Share
The Centre spoke with Angeliki Nika, a Geneva-based Senior Analyst with ACAPS, a non-profit, non-governmental project that has been providing independent analysis for the humanitarian sector since 2009. We discussed their focus on secondary data collection, how they created their popular COVID-19 Government Measures dataset, and why humanitarians tend to underestimate their data literacy.
This interview was conducted by Becky Band Jain, the Centre’s Communications Manager. It has been edited and condensed for clarity.
Can you give us an overview of ACAPS?
ACAPS supports the humanitarian community’s work on severity and trend analysis for more than 100 crises around the globe. We help humanitarian actors anticipate and respond to emerging crises. We provide analysis at the global and crisis-specific levels. The global team is in Geneva and we have hubs in three field locations: Amman (for Yemen), Colombia (for Venezuela) and Cox’s Bazar in Bangladesh.
I am leading a team of nine analysts working on the CrisisInsight portfolio covering 100 countries. Four other colleagues work on a more rapid analysis, including developing briefing notes in response to disasters. We use different methodologies to provide a comprehensive picture of humanitarian crises. ACAPS collects secondary data through partners or research, relying heavily on HDX to do this. We also use other OCHA information products like situation reports and humanitarian needs overviews, among other sources. The analysts monitor the crises and then apply data analytics techniques to the information.
We are also an implementing partner for the INFORM Severity Index, a regularly updated model for measuring the severity of humanitarian crises. It is a composite index bringing together 31 core indicators, organized in three dimensions: impact, conditions of affected people, and complexity.
What is unique about your analytical process?
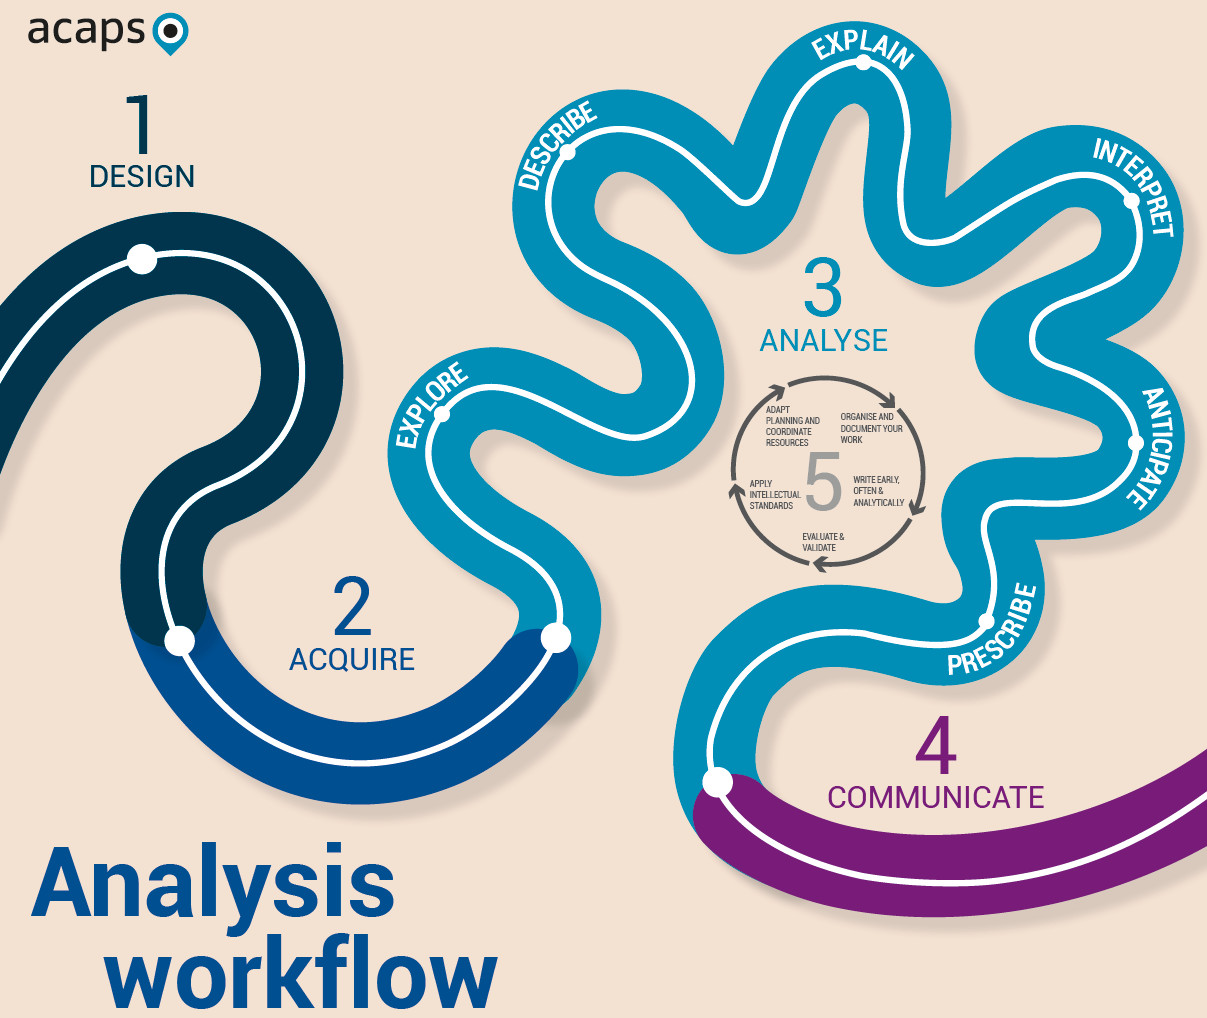
Our approach is simple but innovative. We categorize and do secondary analysis that provides a quick snapshot and is comparable across countries, which partners value. We use an iterative process: we start with an analytical framework, do data collection, and then improve the framework based on findings.
We have developed publicly available methods for doing effective secondary analysis. We also have resources on how to develop analytical thinking and apply qualitative and quantitative information, and how to avoid cognitive biases and develop logical reasoning. By providing humanitarians with these tools and analysis, we hope they can make more informed decisions.
How do you use the Humanitarian Data Exchange?
HDX is one of our main tools for finding data. We also use it to share six datasets that we regularly update. HDX has improved the accessibility of our data to a larger group of people and organizations. We also use it to inform our analysis of the country portfolio and we regularly contact data contributors to ask questions about their collection method or about the data itself.
Tell us about your COVID-19 datasets.
The idea for the COVID-19 Government Measures dataset emerged at the beginning of March through discussions with different partners about their needs for analysis. Government policies in response to the pandemic affect not only humanitarian policies but the actual situation on the ground. Many of the measures impact issues around displacement, humanitarian access, and humanitarian operations.
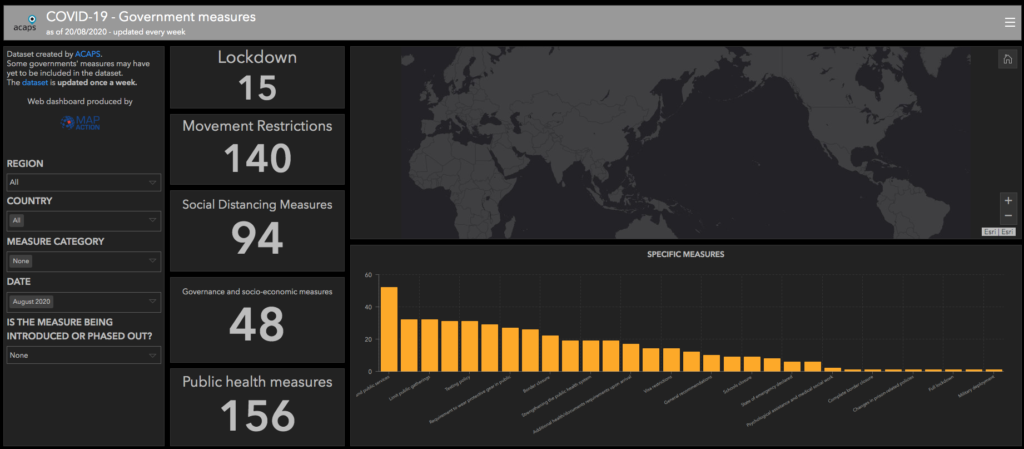
In the first couple of weeks, our analysts worked to get the dataset ready. Once the analytical framework was more stable and partners provided their feedback, we created a team of seven volunteers (mostly Masters students from the University of Copenhagen) who we trained on how to do data collection. Since making the dataset available in March, it has been downloaded about 40,000 times, including over 15,000 downloads from HDX.
We have just released an additional dataset that captures secondary impacts of COVID-19 across relevant themes such as economy, health, migration, and education. Since capturing and analysing secondary impacts is much more complicated than capturing government measures, we needed more time to develop the analytical framework. Our three analysts dedicated to this project recently finished onboarding the volunteers and training them for this data collection.
What are some of the challenges you face when working with humanitarian data?
Producing easily understandable information for non-technical people is both a challenge and an opportunity. Humanitarians tend to underestimate their data literacy. They think that some things are technical and require math or statistics, but it’s often not the case. Many humanitarians have the basic knowledge necessary and can understand the information better than they think.
For instance, I have a legal background with experience in refugee and migration law. While it was a big switch to go into data and analytics, it was always a passion of mine. I developed the skills on the job and am currently studying statistics.
“Humanitarians tend to underestimate their data literacy. They think that some things are technical and require math or statistics, but it’s often not the case.”
What are some of the trends you are seeing with your work?
Humanitarians are more interested in data, especially for decision making, and they are becoming more data literate. We are seeing more organizations that want to be involved in analysis and that want to increase their in-house analytical capacity. More users are downloading and using the raw data from HDX or our website rather than the narrative reports. The switch happened very recently. For example, the Government measures dataset has many more downloads than the accompanying report.
Users are developing new products such as datasets and visualizations based on the data. They merge our data with other datasets to create entirely unique ones, and sometimes we only find out about these through social media.
Also, organizations are now more open to sharing their data and information than they were previously, which is very important for us. We need to easily access information so that we can include it in our analysis.
What’s next for ACAPS?
ACAPS has been growing and it is great to see. Our focus is on producing better quality analysis and improving our methodologies, especially the globally comparable datasets for decision-makers to combine with their own data. We are also further developing the CrisisInsight portfolio as well as an API that will facilitate access to our datasets and connections with other platforms such as HDX.
What do you love about what you do?
I love being able to provide useful information to people. I enjoy translating complicated information into a straightforward format. I also like working with our analysts and our volunteers who are passionate about using data.