Share
The Centre talked to Emma Mumford, Operations Director at MapAction, an organization that has been making maps to help coordinate emergencies since 2003. We discussed how MapAction trains its volunteers, recent deployments, and trends with mapping in the humanitarian sector.
The interview was conducted by Elizabeth Wood, the Centre’s Communications Manager. This interview has been edited and condensed for clarity.
What does MapAction do and how has that evolved over the years?
MapAction was founded on an understanding of two things: maps are a very helpful way to share information, and mapping allows you to see just how close you are to a particular problem or to the work of another agency. We’ve shifted from being an organization that just provides visualizations and maps, to one that offers a broader set of data services to the humanitarian community.
How does MapAction work? What’s your business model?
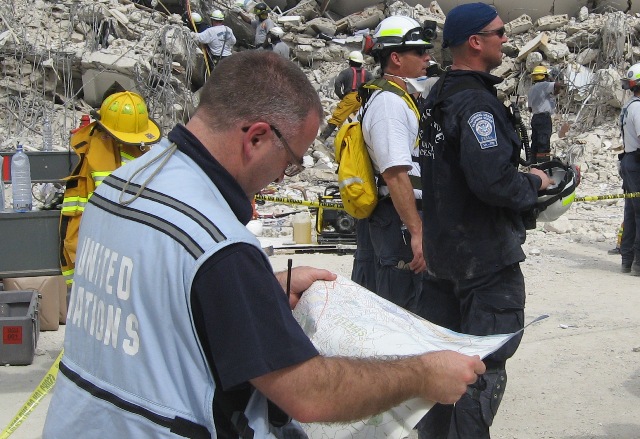
MapAction supports responders remotely or in country. This can be a combination of surge support, the provision of remote services or the provision of tools for responders to use. Our core task is spatial analysis of hazards. We work alongside those who are responding to provide analysis and bring approaches from many different corporate, government or non-governmental perspectives.
How are the volunteers selected and trained?
Volunteers are recruited once a year around March. They all have day jobs and generally work on a range of issues, from flood response in the UK to global hazards such as volcanoes, earthquakes, and landslides.
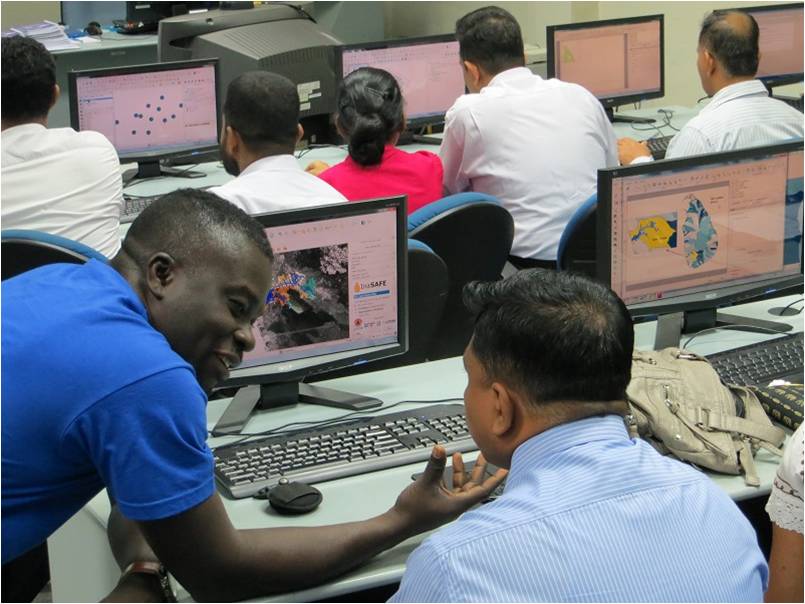
We recruit for an existing level of competence in GIS and data services, and then train on how to apply these skills to activities in humanitarian response. MapAction trains in security, first aid and the skills required to work and live in remote environments or environments affected by a crisis. A huge benefit of the training is getting together dozens of data and map-interested people to share skills and experience! Map geekery is strong!
“We love HDX! We support data sharing wherever possible and HDX is a great platform and single place to share data and to link partners.”
Can you provide an example of a MapAction deployment?
We deployed to Indonesia to support partners at the AHA Centre following the earthquake and tsunami in Palu in September 2018. We have a long-term relationship with the AHA Centre and they know our service offering well. In this case, the AHA team had been responding non-stop for several weeks to other emergencies in the country so we came in to reinforce their team for the Palu crisis. AHA colleagues tasked our team with creating maps and data products.
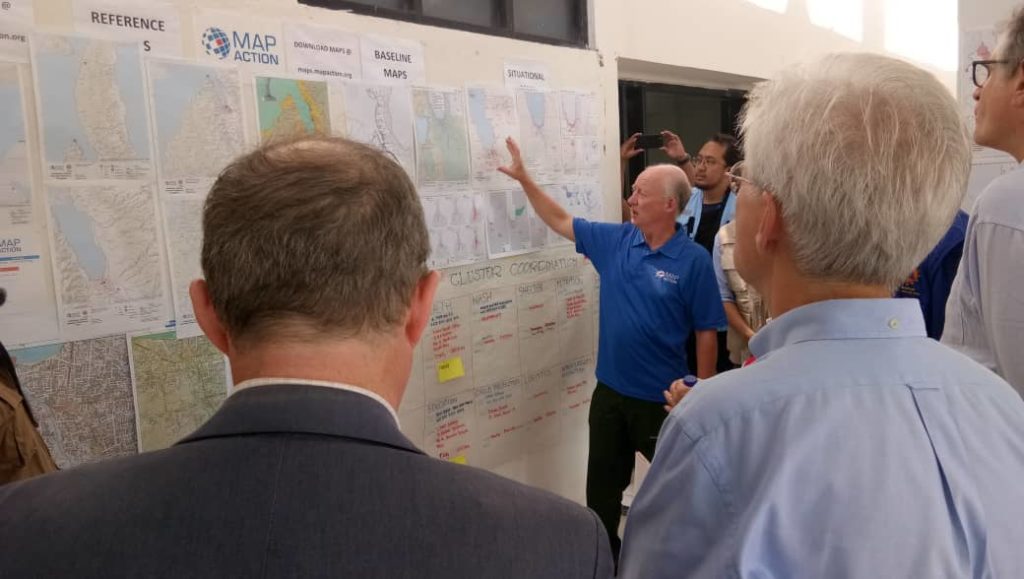
We just deployed a team to Mozambique to support the response to Cyclone Idai which made landfall along the south-eastern coast of Africa on 14 March 2019. We sent an Emergency Response Team at the request of the UN. The team is working at the heart of response planning and coordination, providing situation maps and information management services. In addition to our in-country team, technical volunteers have been working remotely on flood extent modelling and on gathering and sharing useful reference data to help response teams.
What are some of the challenges with mapping in the humanitarian sector?
It’s still a challenge to work across the digital divide. There are agencies that have access to a lot of resources in terms of hardware and software, while others don’t have any. We want to be able to provide services to all of them. If you look at where we were 15 years ago, there weren’t that many mappers deploying into responses. Just having a reference map was really useful for agencies. Now there can be an overwhelming amount of data for responders to sort through.
What is the biggest opportunity?
A lot of existing systems are geared towards feeding a regional or global view of a situation to support resource allocation, and this is critical. I think there is a gap in getting information and data to local-level responders, humanitarians or governments at the smallest geographical level. In my experience, coordination works best at this local level, and getting those teams the information they require is where I think we could best serve responses.
How have digital mapping tools changed MapAction’s focus?
There has been a big move to web mapping. More processes are being automated with less focus on cartography and more on software. There has been a proliferation of interactive maps. That said, depending on the circumstance, we have noticed that for interactive maps where people can turn the layers on and off, they don’t always do that or interact with the map at all. In this case, tiled static maps are better so people can see all of the information at once.
There has also been a rise in the use of Google Maps, and people having more access to mapping services without a specialist, which is great. People can add data to a premade map. People love the idea of satellite imagery because the visualisation gives you an instant orientation. Derived products from satellite imagery, for instance the boundaries of a flood, are very useful to add into services.
Do your teams use HDX?
We love HDX! We support data sharing wherever possible and HDX is a great platform and single place to share data and to link partners. We did some work with UNICEF in Guyana and one of our objectives was to make sure the datasets were published on HDX.
Another objective is to work with the HDX team on the new ‘data grid’ [a new feature that shows what priority data is available and missing for crises]. We’ve been trying to provide agencies with a ‘data digest’ to help them understand what data is available. After meeting with the HDX team, we think we could use the data grid for that. We’ve also been experimenting with using Data Check, and we would like to HXL-ate our datasets.
What’s next for MapAction?
We would like to look at more automation of services for responders, and ensuring our services work across partner infrastructure. At present, we do a lot of manual work on data sourcing and publishing: we put the data into an Excel spreadsheet, visualise it on a map for a partner and publish it on a website and through HDX. We’re not necessarily looking at the partner’s infrastructure and how we can enhance, simplify or automate processes, which is something we want to do.
Learn more about MapAction here. Follow them on Twitter at @mapaction.