Share
Until today, every dataset on HDX has stood alone. Our users could visually preview a dataset and explore interactive visualizations based on a dataset. But in each case, it was a single dataset, a view of one dimension of a humanitarian crisis. However, humanitarian crises contain many dimensions, and the Humanitarian Data Exchange (HDX) team, as well as our users, have always recognized the need to combine datasets into a broader view of a crisis to support both advocacy and operational decision making.
Over the last few months, the HDX team, with help from our users and partners, has worked to build a prototype ‘map explorer’ that allows users to build a multi-dataset view of a crisis. The prototype is built around the Lake Chad Basin crisis, and allows users to visually explore relationships in datasets about displacement, population, fatalities, conflict locations, humanitarian funding, and food security.
We wanted to achieve a balance between a tool that is flexible enough to allow users to turn their data into common visualizations but simple enough for users who might not want to learn more powerful data science tools like Tableau. Akiko Harayama, a data visualization specialist and cartographer with OCHA’s Visual Information Unit (VIU) generously shared her expertise with the HDX team. The VIU is often tasked with building both static and interactive visualizations to highlight various crises in which OCHA is working. OCHA’s regional office in Dakar, Senegal helped us understand the data for the Lake Chad Basin crisis which has displaced over 2.6 million people in 4 countries (source).
To get the work started, we brought a diverse team together from New York, Geneva, and Bucharest for a week long sprint in Liverpool, UK. We were graciously hosted by ScraperWiki in their offices, and Peter Waller, one of ScraperWiki’s data scientists, also pitched in to help us. Having users, designers, and developers all in the same room made it easy to find design problems or backend complications and resolve them quickly. It’s also just really fun to have the people you work with all in the same place every once in awhile.
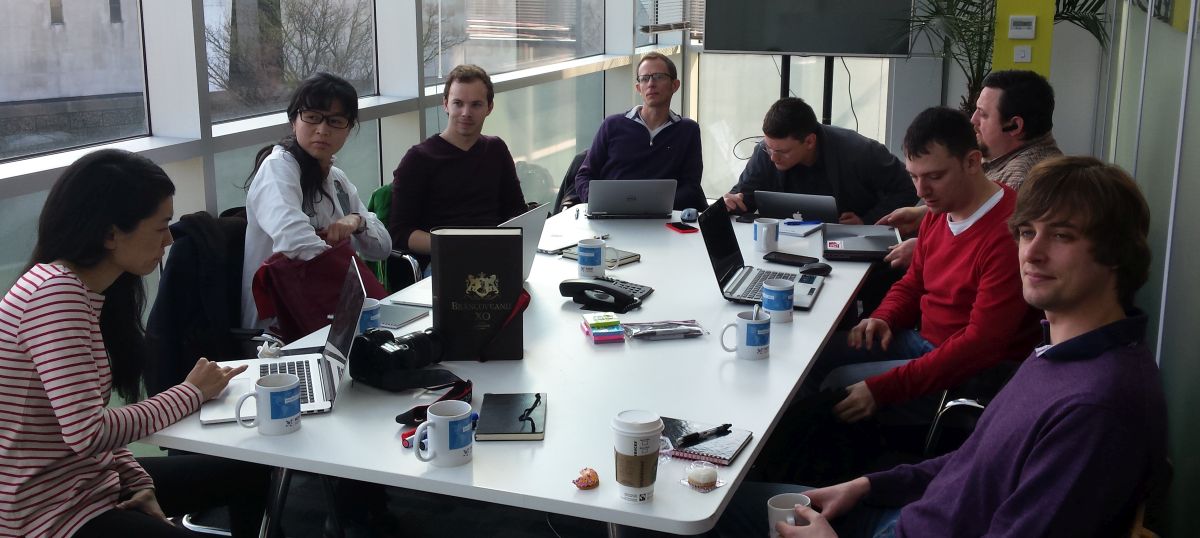
Photo: Aidan Mcguire
OCHA’s team in Dakar gave us periodic reviews as development continued after the sprint in Liverpool, and we reached out to a variety of HDX users to get their opinions about the tool. Thanks to everyone who gave their input. We also want to say thank you to those organizations whose data populates the tool: IOM, UNHCR, ACLED, WFP, OCHA ROWCA, and OCHA FTS.
Today, we are ready to show what we’ve built to a wider audience and we welcome your feedback.