Share
For some time, we have been measuring what data is viewed and downloaded on HDX. We decided to make these stats available to our community through interactive charts on all dataset and organisation pages. We hope this helps show the value of data sharing and the patterns of data use on our platform.
Stats about Organisations
You can now find a ‘Stats’ tab on all organisation pages, like this one for the UN Operational Satellite Applications Programme (UNOSAT).
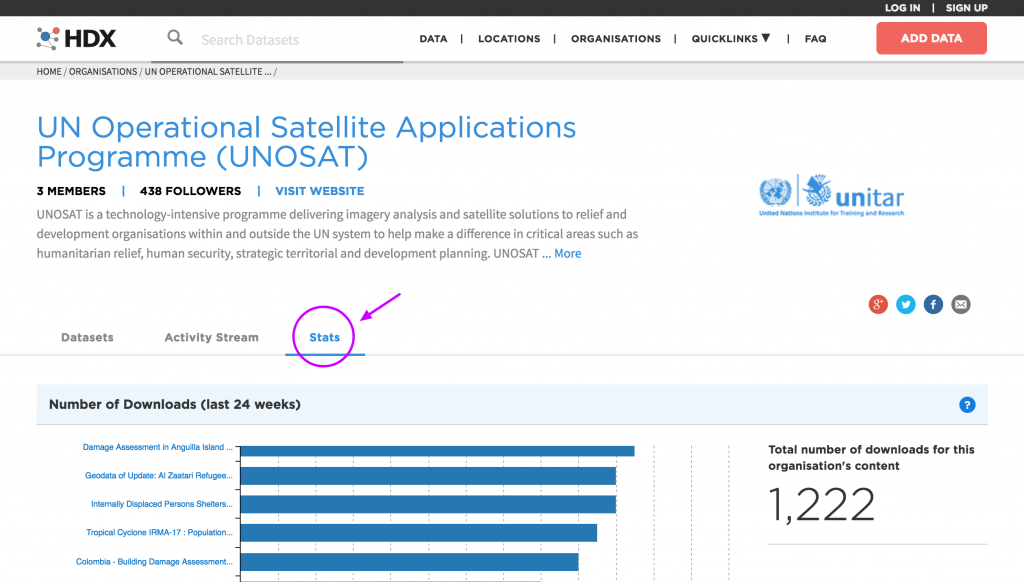
The stats page provides an overview of an organisation’s most popular datasets, both in terms of the number of individual datasets downloaded and the total number of downloads for all datasets over the past 24 weeks. You can also see the number of unique visitors who have viewed or downloaded data over the past 30 days.
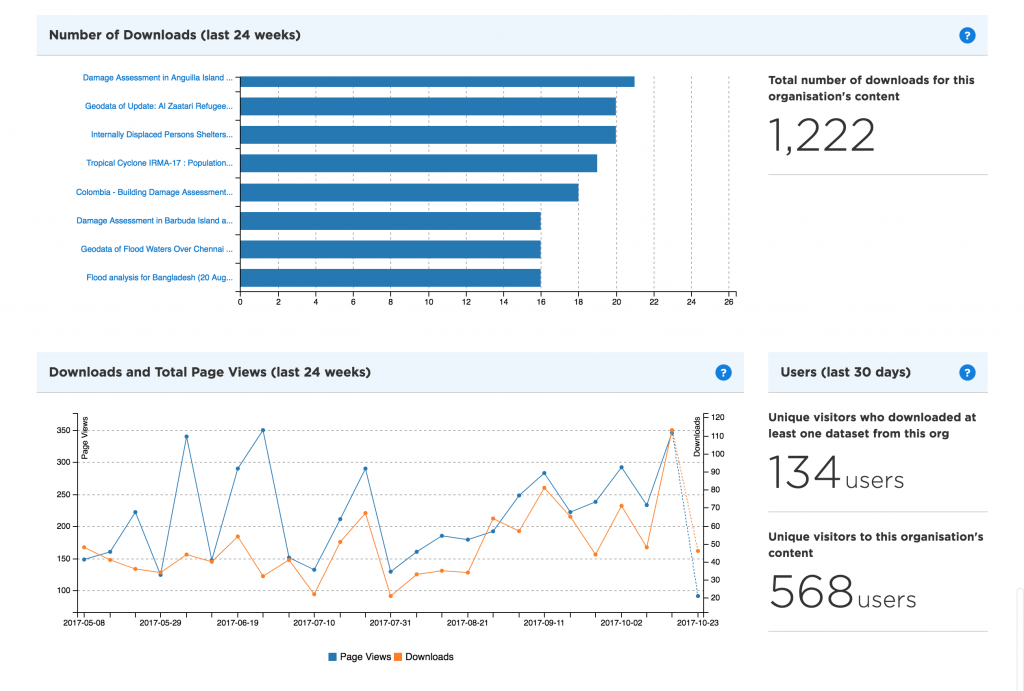
For example, the Humanitarian OpenStreetMap (HOT) stats page shows eight of its most popular datasets. This list will change based on user interest, but half of the datasets were related to Bangladesh in October. It also shows that, on average, one in three people who view HOT data on HDX end up downloading it.
Stats about Datasets
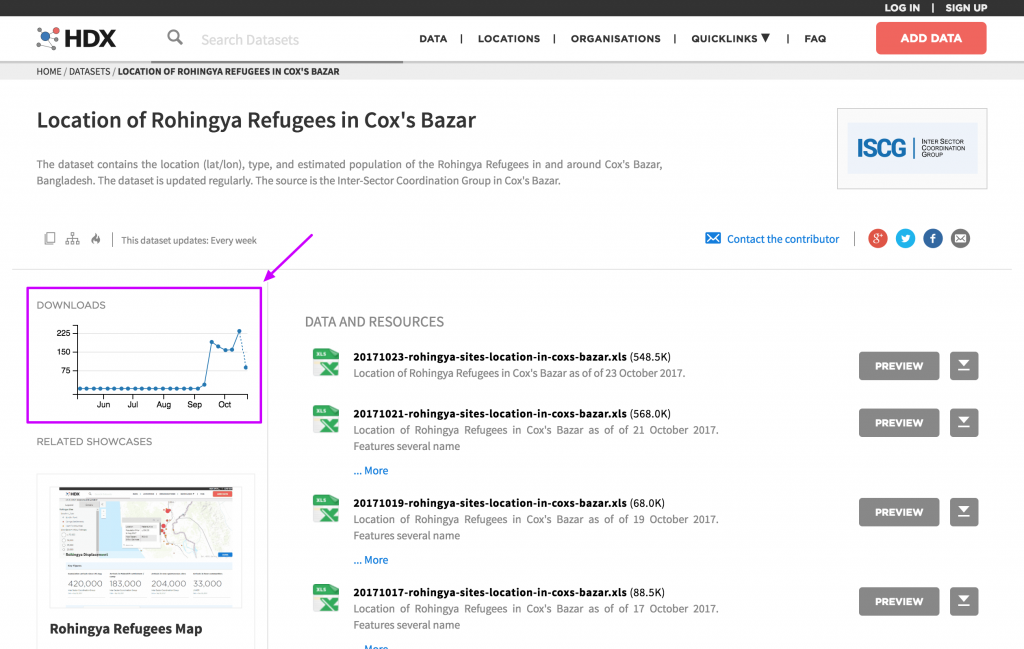
To better understand the use of individual datasets, a timeline of weekly, unique downloads over the last six months is displayed on each dataset page. For example, the dataset on the location of Rohingya Refugees in Cox’s Bazaar has been downloaded hundreds of times since it was added to HDX in early September.
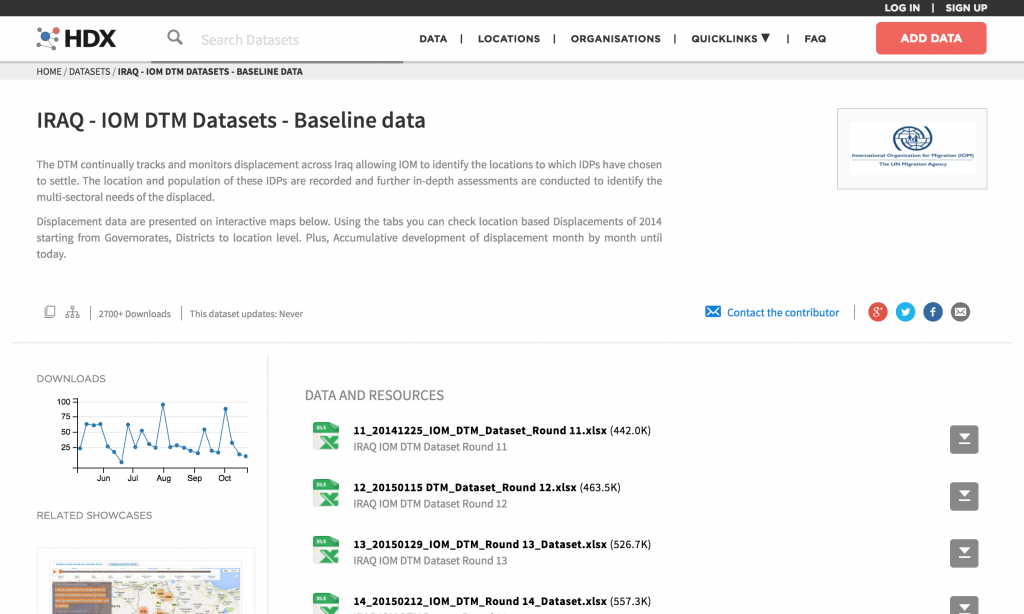
In contrast, one of the most heavily downloaded datasets of all time is the IOM Displacement Tracking Matrix data for Iraq.
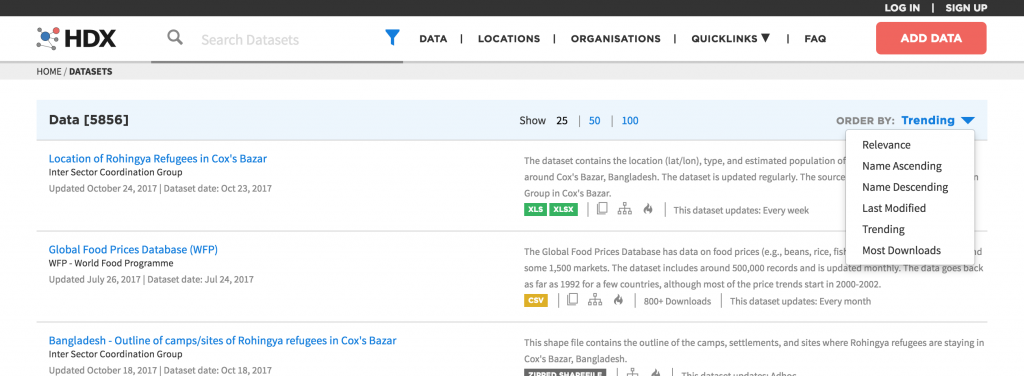
The dataset list page on HDX shows all data that is ‘Trending,’ which refers to data that has the highest number of page views within a 14-day history. You can toggle this view to ‘Most Downloads,’ which refers to the total number of downloads since we started using Mixpanel in August 2016.
How are we counting?
We try to give conservative figures, which is to say that repeated visits by the same user (i.e., same browser cookie) are counted only once. In other words, we are trying to approximate the number of individuals who have visited a page. A user visiting from different browsers or from different devices will be counted separately, but only once per browser or device.
For downloads, the calculation is a little different. Repeated downloads over a span of time by the same user are important as they may indicate downloading of updated versions. So for downloads, we count a maximum of one download per day, per user (again, based on the same browser cookie).
Note that these statistics are not real-time. There is up to a one-day delay between when a user views a page or downloads a resource and when this activity becomes visible in these charts.
Feedback
We have other ideas about how to show the value of a dataset based on user interactions, but we would love to hear what you think would help. Ideas and feedback on what we have done so far are always welcome at hdx.feedback@gmail.com.