
Partners:
Cash Learning PartnershipCentre Service:
Data ServicesTags:
Summary:
The Centre for Humanitarian Data partnered with OCHA Somalia and the Cash Working Group to develop an easy-to-use dashboard with an overview of the cash-based assistance being reported by humanitarian organizations in Somalia. The data visualization shows that cash assistance is on the rise with $28 million distributed to 4.8 million people in November 2018. This collaboration has made it easier for field teams to provide quick updates to senior managers and donors on how cash is being used to support affected people. Justin Brady, the Head of Office for OCHA Somalia, told us that the work on the visualization allowed them to reinvigorate the cash process, which was crucial to preventing famine in 2017.
Challenge:
In early 2017, the OCHA Somalia office was working with partners to understand cash distribution across the country but lacked the capacity to process the data and create a visualization. Cash-based assistance refers to all programmes where cash or vouchers are provided directly to individuals, households or communities. OCHA Somalia was requesting all partners to report their data on their cash or voucher-based interventions, using the WHO does WHAT WHERE (3W) template.
The OCHA office first contacted the Humanitarian Data Exchange (HDX) team in March 2017 to see what data support could be provided. The initial focus was on cleaning and merging the data that existed and exploring what insights could be visualized. This analysis revealed gaps in the data that OCHA Somalia worked to fill through its relationship with the Cash Working Group and local partners.
Centre action:
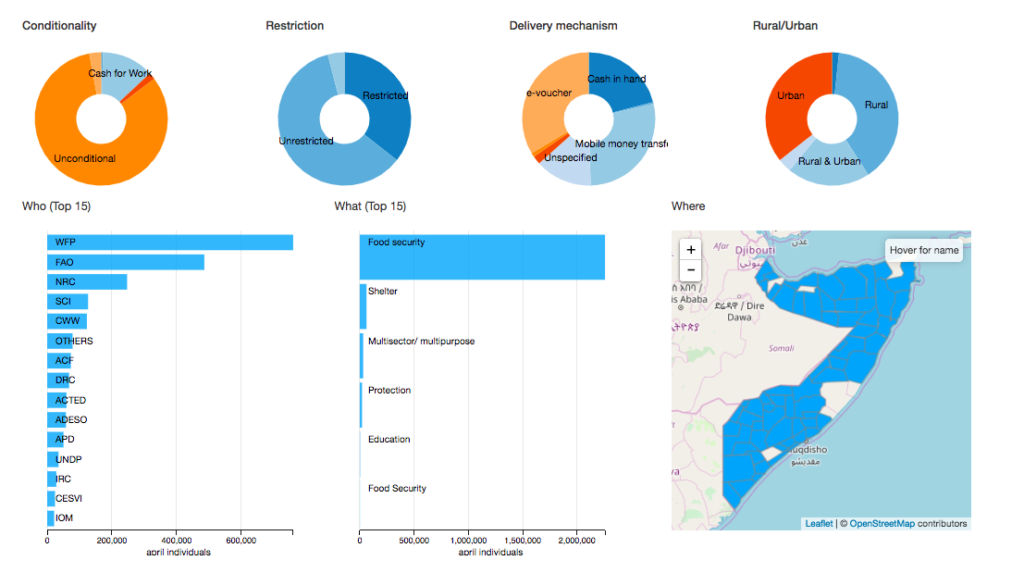
Once some of the data challenges were resolved, the HDX team created the first visuals. It was a simple ‘3W’ showing who was doing what where with cash at the district level. People exploring the visual could sort the data by whether the cash was conditional (for work) or unconditional, restricted or unrestricted (for particular goods, services or vendors), how it was delivered (cash in hand, mobile money, or e-voucher), and whether the location was rural or urban. It was also possible to see which partners and sectors were most involved in cash programming in each district, and to see the districts where no cash programming was taking place.
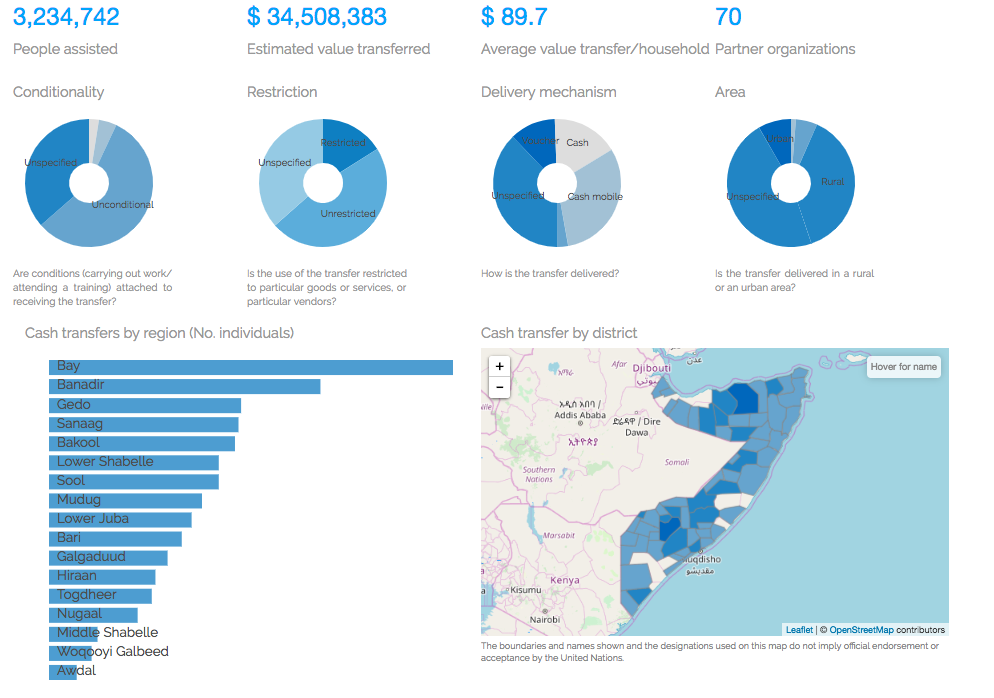
Over time, the HDX team made a number of improvements to the visual based on user feedback, recommendations from the OCHA Information Management Unit, and new data coming in. The second iteration included aggregated values for the number of people reached, how much cash had been disbursed, and the total number of partners involved.
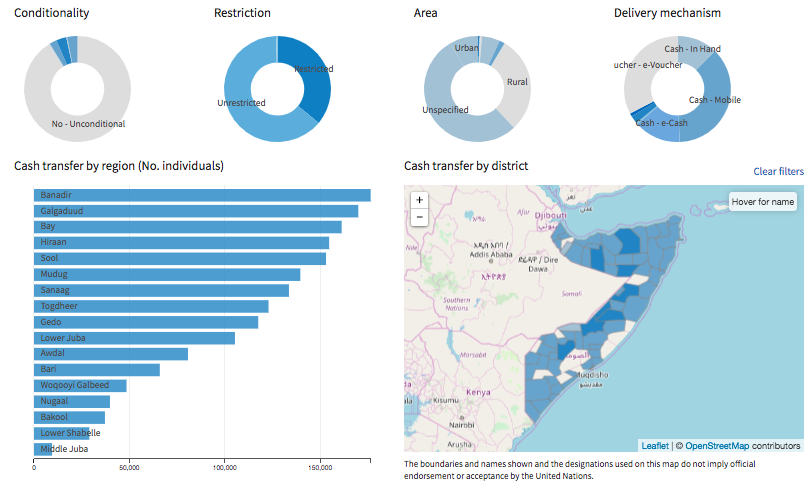
The third and current iteration includes the ability to sort this data by month and to see the cash distribution trend overtime.
As the visual improved, so did the data processing. The HDX team developed a script to automate cleaning for some of the most common discrepancies between data sources. The most recent datasets also include HXL hashtags, making the data even easier to maintain. These tags were developed in consultation with the Cash Learning Partnership (CaLP) and can be applied to cash programming datasets in other contexts to speed up processing and create interoperability.
Outcome:
The data visualization is regularly updated and used by OCHA, donors and partners to understand cash programming in Somalia. The Cash Working Group as well as the Information Management Working Group in Somalia (IMWG) use the visual to drive improvements to the data and conversations around coordinating field operations. Partners can more easily see their contribution to the overall cash programming picture. As a result, they are more invested in sharing data and filling data gaps so that the visual reflects an accurate understanding of cash assistance.
Cash distribution data can be sensitive given security concerns about where cash is being sent in conflict environments. For this reason, the datasets available for download on HDX are aggregated to the admin 1 or regional level, while the visual allows users to explore the data at the admin 2 or district level. This constraint has allowed the HDX team to improve how it manages sensitive data and how to balance the risk and utility of raw data.
The collaboration built trust between the various teams and led to a second engagement to visualize data about the overall response in Somalia. This visual shows the number of people targeted and reached by each sector and for each region.
Conclusion:
The Centre’s work with colleagues in Somalia is a great example of how remote data support can be used to backstop a busy field team. The field staff were able to leverage their operational expertise and trusted relationships to bring the data together and make sure it represented the reality on the ground, while the HDX team was able to use its technical expertise to process the data and draw out insights for decision makers.
The process to create the visual can be applied to other crises where partners are using cash programming, and the dashboard can become a standard product produced by OCHA offices or local cash working groups. The Centre has been working with OCHA Myanmar to create a similar visual. We hope that this work can be re-used and provide the same efficiencies and impact that we have seen for Somalia.