Geospatial Data and GIS
Geospatial data is the data used to represent features, places, or objects on the Earth’s surface. Working with this kind of data requires an understanding of a few concepts that are unique to geospatial data. In this video, we will discuss a few of these concepts that you’ll and in the accompanying tutorial, you will learn how to import and explore geographic data in QGIS.
Tutorial
For the tutorial, we will be using QGIS. Before getting started, download QGIS and choose the latest Long Term Release. This first section will walk you through the basic navigation of QGIS and you will learn how to import the datasets we have downloaded from the Humanitarian Data Exchange.
Create your own working folder
The first thing that we are going to do is create a standard folder structure that we will use throughout the course. Below is a suggestion of what a folder structure could look like. If you already have a structure that works for you, please feel free to use that.
Create a course folder, and four sub-folders:
- Data will contain the data we will download and use
- Maps will contain the map projects we create
- Products will contain the final map products we create
- Resources will contain external resources such as logos and documents
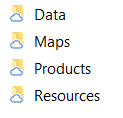
We like to add the following sub-folders to the data folder:
- 1_Original: This is where we will keep an original copy of every data source we download that we can always refer back to. This is where we will save the files we download. Create as many sub-folders as there are data sources.
- 2_Active: This is where we store the data that we are actively using in our projects. We usually copy the data from the original folder, rename it in using a naming convention (a simplified version of which is iso3code_theme_source_freetext) and store it in sub-folders according to the data theme

Downloading data from HDX
Let’s download the data we need. First, go to the Ethiopia country page on HDX. From there, explore the data that is available. For this course, you will need to download the following datasets
Please download the following in “shapefile” format:
- Ethiopia – Subnational Administrative Divisions
- Ethiopia – Cities, towns and villages
- Ethiopia Road Network (main roads)
- Health Facilities in sub-Saharan Africa
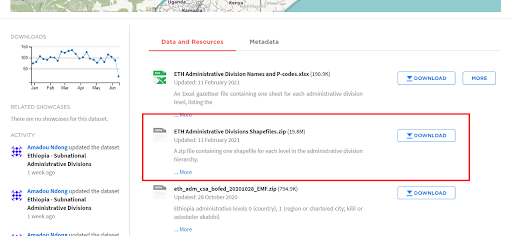
Please download the following in “GeoTiff” format:
- Ethiopia: High Resolution Population Density Maps + Demographic Estimates (population_eth resource)
Once you have downloaded the files, place them in the original data folder according to their source: for example, both settlements and administrative boundaries were produced by “OCHA Ethiopia”, so you should create a folder with that name the original data folder and store those datasets there.
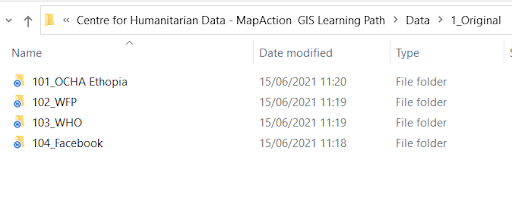
Please unzip any dataset that is zipped, and copy all these datasets, except the Health Facilities, in a relevant location in the “Active” data folder.
Be careful when you copy a shapefile! A shapefile is made of numerous files, so make sure you select them all when you copy. We will talk more about shapefiles in the next module.
Lets take the example of the administrative boundaries and settlements datasets. Copy the Admin 1 and 2 data in 201_Admin, and the settlements in 202_Settlements. Once in their final location, you can rename them into your preferred naming convention, as in the example below.
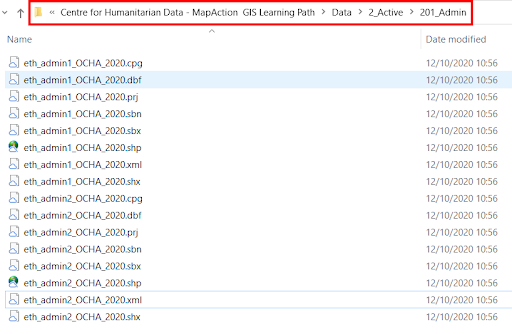
The “Active” data folder should now look more or less like this, and each of these folder should contain the renamed datasets (except the 205_Health, which we will work with in Module 5):
Importing data
After downloading QGIS from the link provided above, launch the software.
The software has three main sections:
- a top bar, with menus and tools used to perform operations on the data;
- a left-hand side panel with a browser to import data and visualize the data that is currently imported into the project; if you do not see the panels, or close one by mistake, check out the Good to know section at the end of the module
- a large map canvas in the center, which will be white when you launch the software, and that will allow you to visualize your data and interact with it.
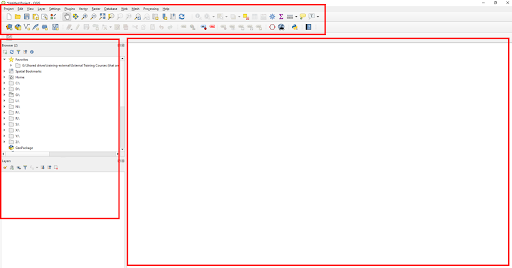
What if you close the software panels by mistake? Navigate to the third menu above, “View”, and select the option “Panels”. And select the panels you would like to view
Let’s start by importing the first three layers we need for our basic reference map. We need:
- a layer showing the shape of our administrative boundaries;
- a layer showing the road network; and
- a layer showing key settlements.
Three Ways to Import Data:
- Open your file explorer, navigate to your active data folder, the 201_Admin, select the administrative boundary 1 layer that ends with “.shp” and simply drag and drop it in the software. Do the same for the other two datasets we are using now – the road network and the settlements.
- From the browser panel, navigate the location of your data folder. Once you find your working folder, you can save it as a Favourite by right clicking on your mouse and choosing the second option, with the star. This will make sure your working folder is saved in the program, at the top of the browser panel. This way, you don’t have to look for it each time. Navigate to the dataset you are looking for and double click or drag and drop to import any file.
- From the fourth menu on the top, select the third option, “Add Layer”. As we are working with vector data, data that represents physical features that can be symbolized as points, such as the location of a school, lines, for example a river, or polygons, such as the shape of a country, we will choose the first option. We can use the button with the three dots under “Source” to navigate to where our data is. Select again the “shp” file and OK this operation to import.
These are three examples of vector layers: a point, a line, and a polygon dataset. We will look at them in more detail in Module 2.
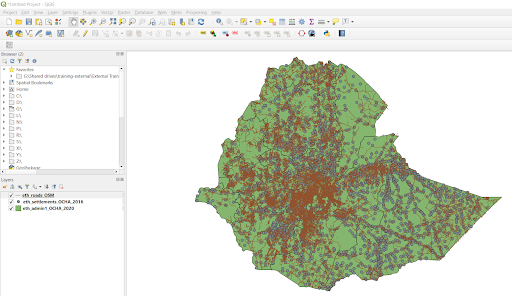
You should now see the data in your canvas. You can pan around the map selecting the hand-shaped tool on the top menu, and clicking on the map to move in different directions.
![]()
Exploring our data
Now, let’s look at how you can organize the visualization of your data in the visualization window.
You move layers up and down in the layers panel, which helps us visualize datasets on top of one another. To do this, simply select a layer and drag it on above or below the other layers. If you drag the admin boundaries to the top, you will no longer see the other two layers.
What if we wanted to only visualize the settlements data layer? In the layers panel, simply unclick the other two layers, which will remove them from the visualization.
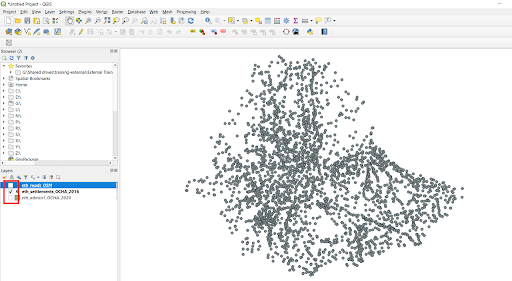
Zoom in/out
Now that we are familiar with the basics, let’s have a more detailed look at our data. To start, you can zoom in and out by using the magnifying glass buttons in the top bar. Try to zoom in quickly.
![]()
If you want to go back to the initial extent, the view where you could see the whole country in the visualisation panel, you can go to the layer’s panel, right click on a layer and choose “Zoom to layer”. This function reset the zoom to include the full extent of the dataset of choice.
Saving the project
Before we go, let’s save our project so that next time, we don’t have to start everything from scratch. Go to “Project”, choose “Save as”, navigate to our folder and save the project under “Maps”.
When saving your map, you want to choose a name that makes sense and provides enough details so that your colleagues can understand what’s included in this particular map project. The date of the project is also important so that we know that the map we are working with is current. Choose a name for the project and click save. You will see the name of the project on the top, and that is a sign that you saved it correctly.
To conclude and recap, so far we learned how to download data from HDX, import it into QGIS, perform basic visual exploration of our vector data, and how to navigate QGIS. Good work!