Share
Humanitarian data is almost always inherently geographic. Even the data in a simple CSV file will generally correspond to some piece of geography: a country, a district, a town, a bridge, or a hospital, for example.
The CKAN framework on which HDX is built provides support for previewing Excel and CSV files. Users are able to quickly see the data in a chart or graph before having to download it. However, that same speed-to-insight functionality was not available for geographic data files. Until now.
HDX has added the ability to preview large (up to 500MB) vector geographic datasets in a variety of formats. Resources uploaded (or linked) to HDX with the format strings ‘geojson’, ‘zipped shapefile’, or ‘kml’ will trigger the creation of a geo preview. Here is an example showing administrative boundaries for Colombia:
We are especially excited to have added this preview support ahead of HDX becoming the new home for the humanitarian community’s Common Operational Datasets (CODs). Over the next couple of months the list of CODs on HDX will grow to several hundred, with the majority available for geo preview.
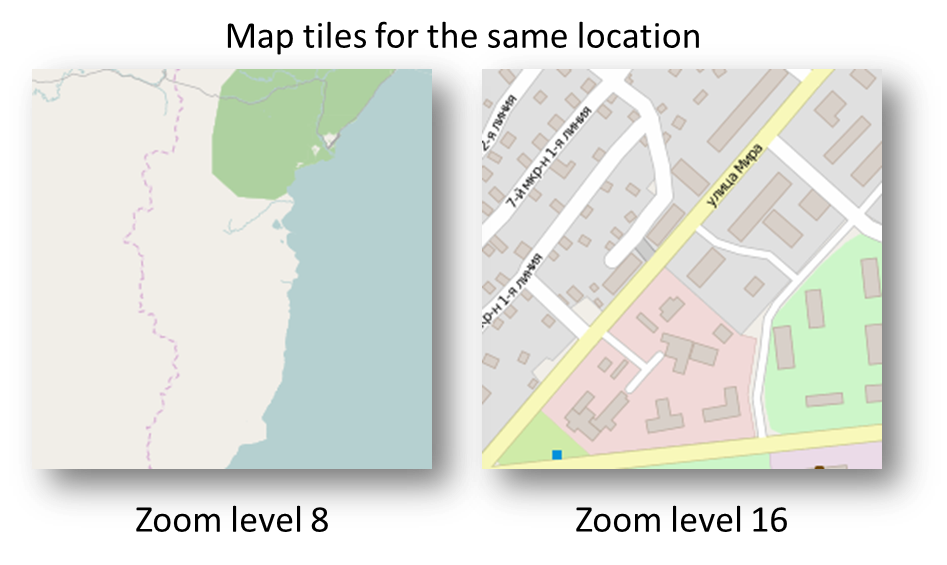
To minimize bandwidth and remain field friendly, we built the preview from vector tiles. This means that details are removed at small scales but will reappear as you zoom in.
The preview is created only for the first layer it encounters in a resource. If the resource contains multiple layers, the others will not show up. For those cases, you can create separate resources for each layer and they will be available in the preview. Multiple geometry types (polygon + line, for example) in kml or geojson are not yet supported.
Future development
This approach gives HDX a good foundation for adding new geodata features in the future. We will be conducting research to understand what users think is important to add next. Here are some initial new-feature ideas:
- Automatically generate additional download formats so that every geodataset is available in zipped shapefile, GeoJSON, KML, etc.
- Allow the contributing user to specify the order of the resources in the map legend (and therefore which one appears by default).
- Allow users to preview multiple datasets on the same map for comparison.
- Automatically apply different symbol colors to different resources in the same dataset.
- Allow users to style the geographic data, changing colors and symbols.
- Allow users to configure and embed maps of their data in their organization or crisis pages.
- Provide OGC-compliant web services of contributed datasets (WFS, WMS, etc.).
- Allow external geographic data services (WMS, WFS, etc) to be added to a map preview.
- Make our vector tiles available as a web service.
If any of these enhancements sound useful or you have new ideas, send us an email at hdx@un.org. If you have geodata to share with the HDX community, start adding your data here.
Appendix: Implementation
This section contains more information about our implementation for readers interested in the technical details.
We started with a sprint where we brought our scattered dev team together in Liverpool and built a quick prototype to test how we might enable preview of geographic data on CKAN. When we released the prototype to the public, we were happy to hear that our users appreciated the ability to preview and explore geographic data before downloading it.
However, our prototype had a major limitation: it worked only for small files, generally less than 1MB. We found that our users were contributing much-larger geo datasets and wondering how to preview them.
It’s a common problem in interactive mapping: to preview the whole geographic dataset, we would need to send all of the data to the browser, but that can require a long download or even crash the browser. The classic solution is to use a set of pre-rendered map tiles — static map images made for different zoom levels and cut into tiny pieces called tiles. The browser has to load only a few of these pieces for any given view of the map. However, because they are just raster images, the user cannot interact with them in any advanced way.
We wanted to maintain interactivity with the data, eventually having hover effects or allowing users to customize styling, so we knew that we needed a different approach. We reached out to our friends at Geonode who pointed us to the recently developed Vector Tiles Specification.
The vector tile solution is a similar approach to traditional map tiles, but instead of creating static image tiles, it involves cutting the geodata layer into small tiles of vector data. Each zoom level receives a simplification (level of detail, or LoD) pass, which reduces the number of vertices displayed, similar to the way that 3D video games or simulators reduce the number of polygons in distant objects to improve performance. This means that for any given zoom level and location, the browser needs to download only the vertices necessary to fill the map. You can learn more about how vector tiles work in this helpful FOSS4G NA talk from earlier this year.
Because vector tiles are a somewhat-new technology, there wasn’t any off-the-shelf framework to let us integrate them with our CKAN instance. Instead, we built a custom solution from several existing components (along with our own integration code):
- OGR2OGR to transform the data.
- Redis Queue to manage the transformation tasks.
- PostGIS to store the data.
- PGRestAPI to generate, cache, and serve the vector tiles.
- The Leaflet Vector Tiles extension to display the tiles client side.
- Our own GISRestLayer to tie it all together.
Our architecture looks like this:
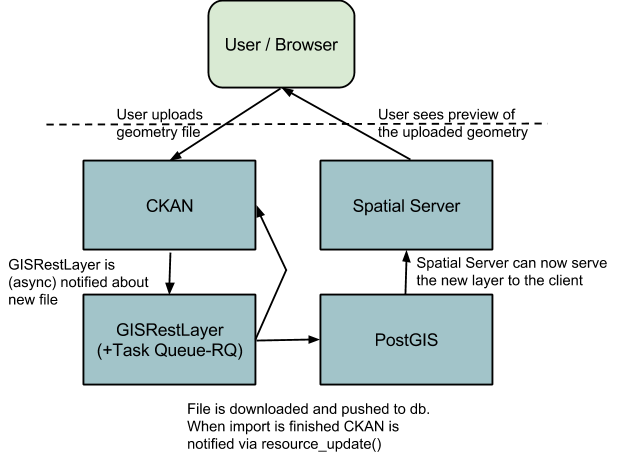
The GISRestLayer orchestrates the entire process by notifying each component when there is a task to do. It then informs CKAN when the task is complete, and a dataset has a geo preview available. It can take a minute or longer to generate the preview, so the asynchronous approach — managed through Redis Queue (RQ) — was essential to let our users continue to work while the process is running. A special HDX team member, Geodata Preview Bot, is used to make the changes to CKAN. This makes the nature of the activity on the dataset clear to our users.
We would like to say a special thanks to Jeffrey Johnson who pointed us toward the vector tiles solution and to the contributors of all the open source projects listed above! In addition to GISRestLayer, you’ll find the rest of our code here.