Share
In December 2017, the UN Secretary-General officially launched the Centre for Humanitarian Data. Its vision is to create a future where people involved in humanitarian crises have “access to the data they need, when and how they need it, to make responsible and informed decisions.” To achieve this vision, the Centre established a detailed plan for providing data services, developing data policy, literacy, and engaging a network to support its mission and objectives.
The Centre’s theory of change suggests timely, quality and accessible data, supported by a network of skilled users, will lead to greater and more effective use of data in humanitarian crises. This, in turn, underpins an assumption that data use is a building block for making decisions that better reflect the needs and circumstances of the crisis. In other words, data have a vital role to play in improving humanitarian outcomes.
To fulfill its vision, the Centre seeks three outcomes:
- Increase the speed of data from collection to published product
- Increase the number and strength of connections with the Centre
- Increase the use of HDX
So, how will we know that the Centre has succeeded in achieving these outcomes?
The Humanitarian Policy Group at the Overseas Development Institute (ODI) has been working with the Centre’s team to review its three-year results framework (July 2017-July 2020) and to develop baselines for three outcome indicators. An independent evaluation of the Centre will take place in July 2019, two years into its three-year framework.
We first assessed whether the original objectives and indicators were appropriate given the stated priorities of the Centre and in terms of the resources available. After making some adjustments, we then measured baselines for these three outcomes.
Outcome 1: Increase the speed of data
Measurement: Number of days required to move from dataset collection to published product
The Centre aims to increase the speed of data uptake, from the point of collection to its use as a published product, such as a data visual, map or a report. We assessed this indicator in two ways: 1) by documenting the steps and timeframes for specific dataset collection efforts; and 2) by graphing the timeframe of all dataset postings to HDX related to particular crises.
For the first part, we documented dataset timelines for five datasets. These included two OCHA who-is-doing-what-where (3W) datasets and three datasets collected by two partner organisations. For the second part, we looked at the dates and type of all datasets posted to HDX for Hurricanes Irma and Maria and the Rohingya displacement crisis.
Speed of individual datasets
In general, the speed of data from dataset collection to use depends on the complexity of the process involved. The timeline for the five datasets ranged from 8 days to 43 days, with a median of 19 days. In all cases, multiple factors ‘blocked’ timely data collection and sharing, all of which delayed upload to HDX or the development of a published product. The blockers included data sensitivities, missing data, a lack of pre-existing standards (such as agreed administrative boundaries), the amount of time spent cleaning and verifying field-collected data, different templates, inconsistent spellings, and the capacity to do the collection or processing.
Similarly, various ‘facilitators’ allowed data to be collected and used more quickly. These included pre-existing templates and processes, trained information management officers, functioning information management working groups, and the use of agreed, cleaned common operational datasets.
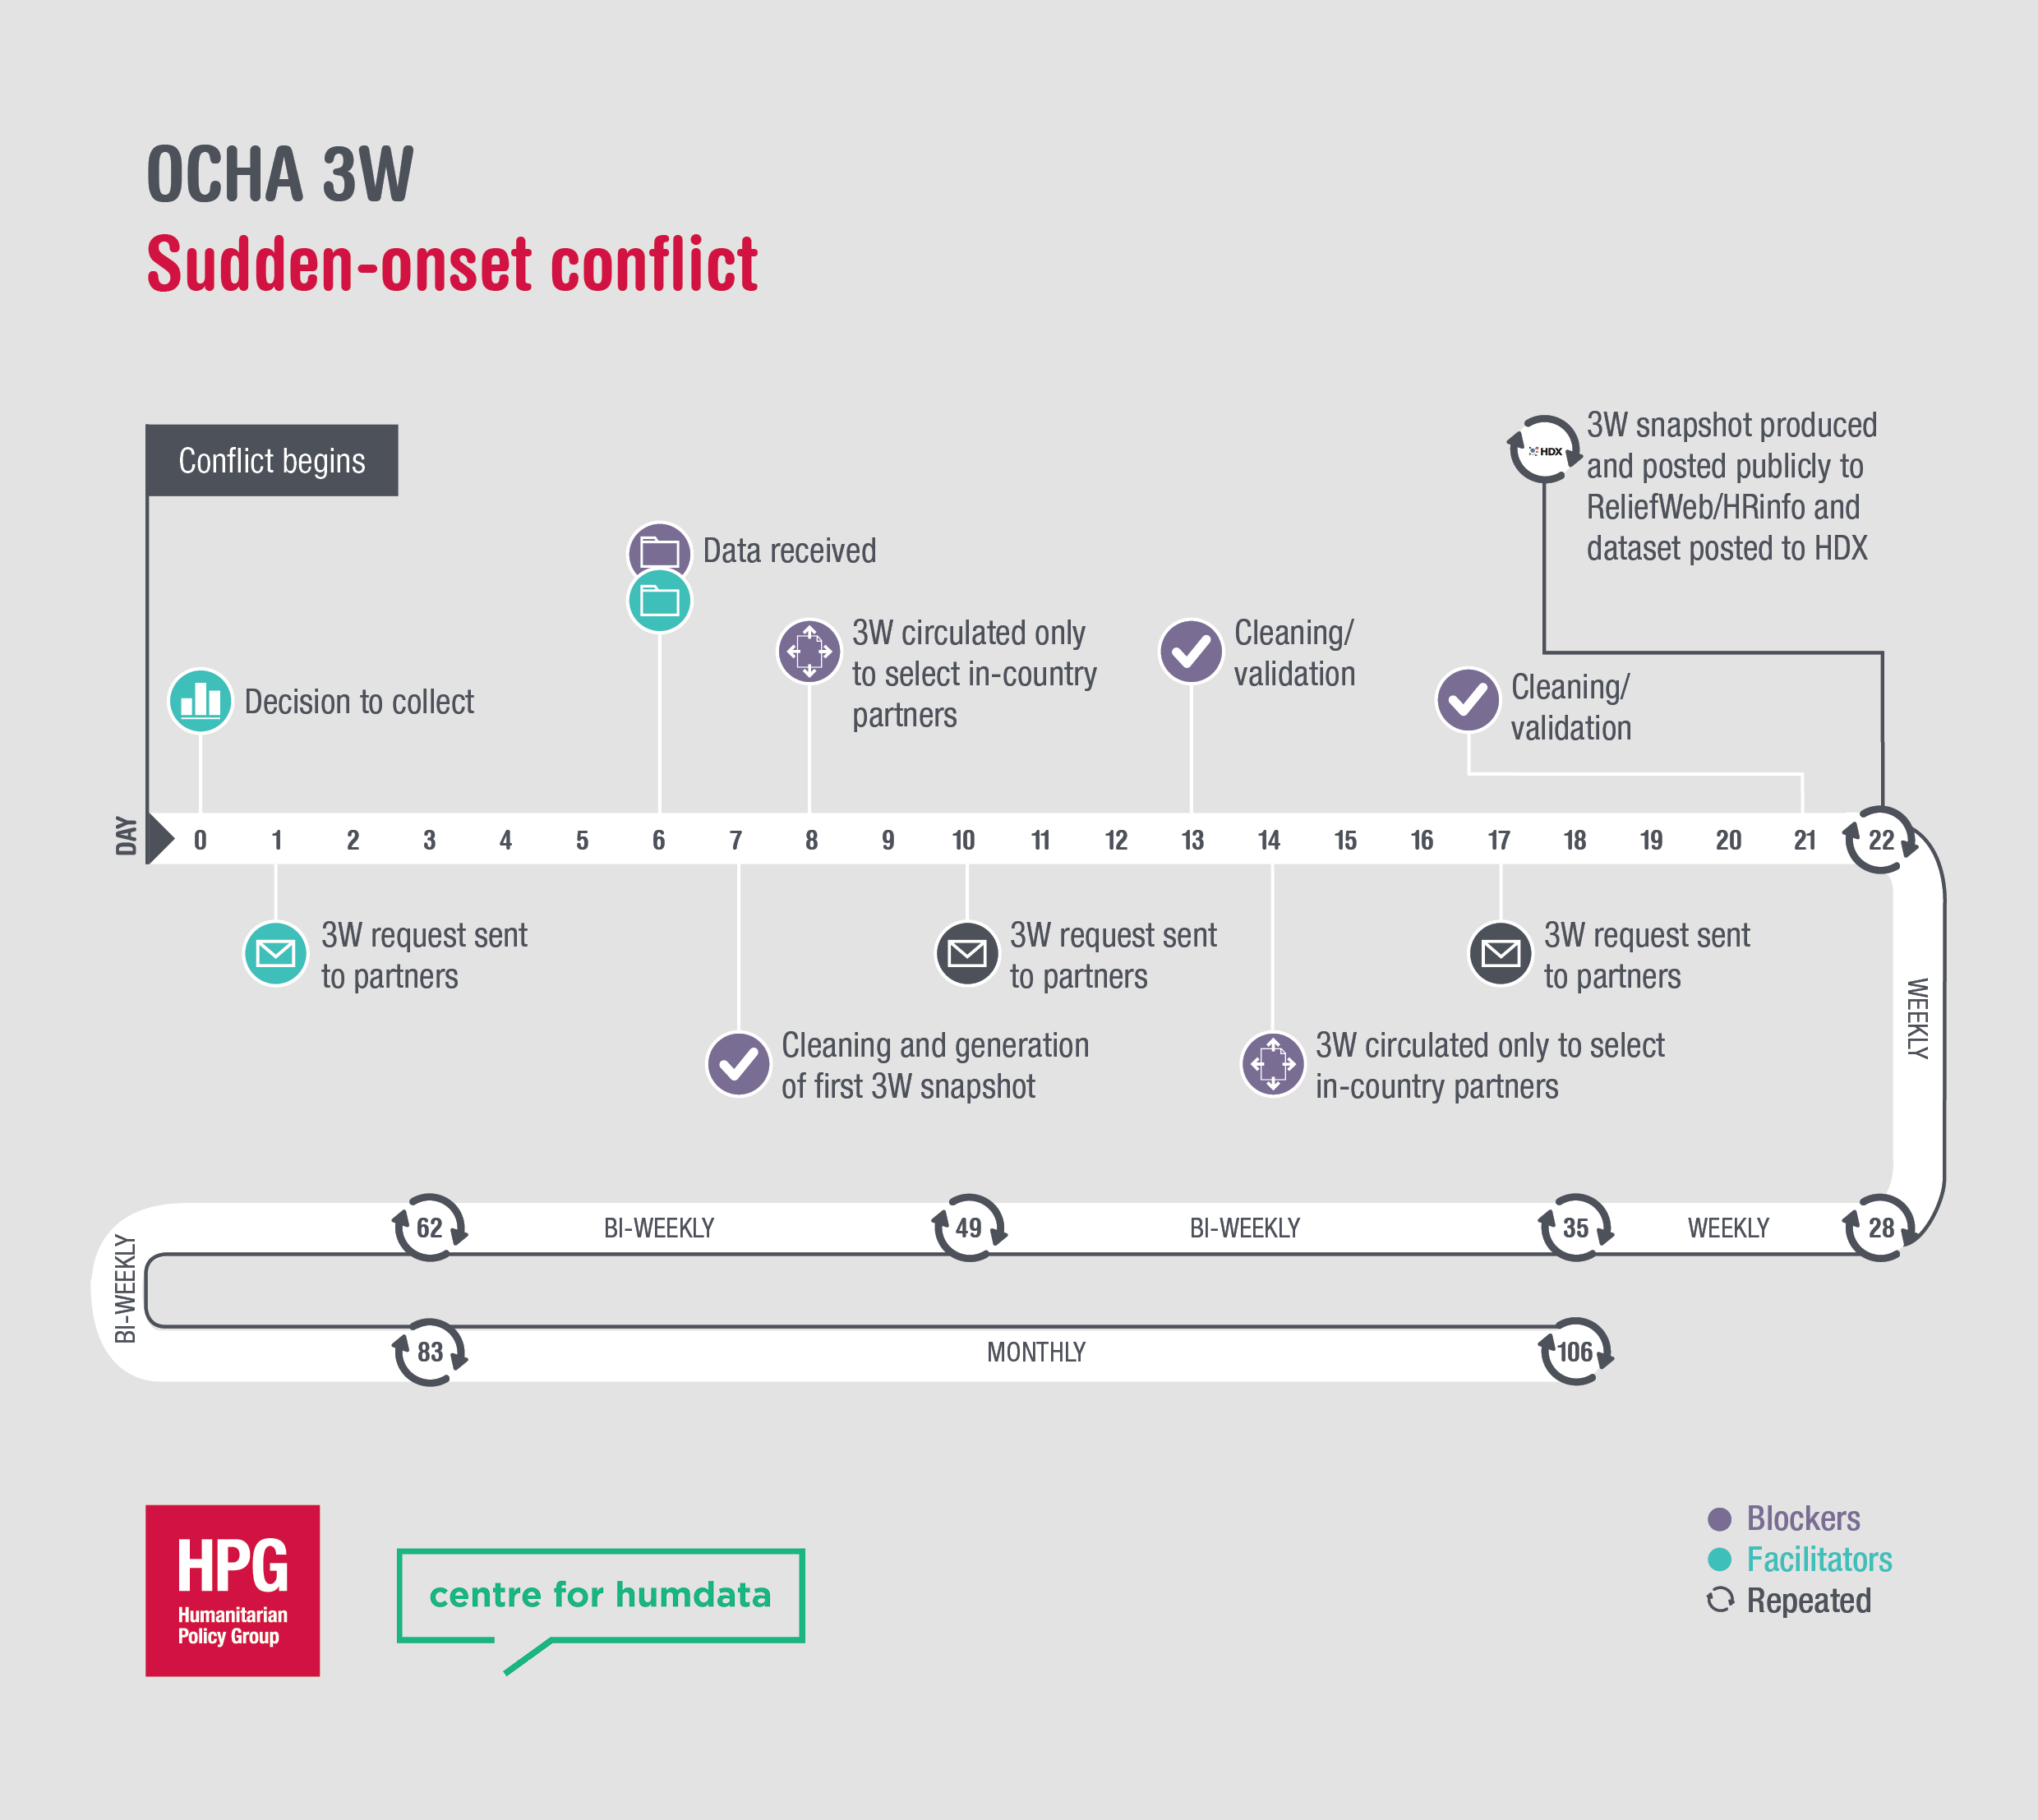
By documenting this process, the Centre will be able to assess efficiencies that occur before posting on HDX (e.g. data cleaning, use of HXL) as well as those that occur after posting on HDX, such as automated tools to visualise data or use of HXL to combine datasets. The Centre will have limited or no effect on the time it takes to collect the data. We have therefore recommended that the indicator language be adjusted to ‘increase the speed of data from the end of data collection to published product.’
Speed of sharing per crisis
We also measured the speed of data by assessing the number and date of datasets uploaded to HDX by multiple organisations that relate to a particular crisis. We graphed new dataset uploads and updates to new and pre-existing datasets using a weekly average of postings to HDX.
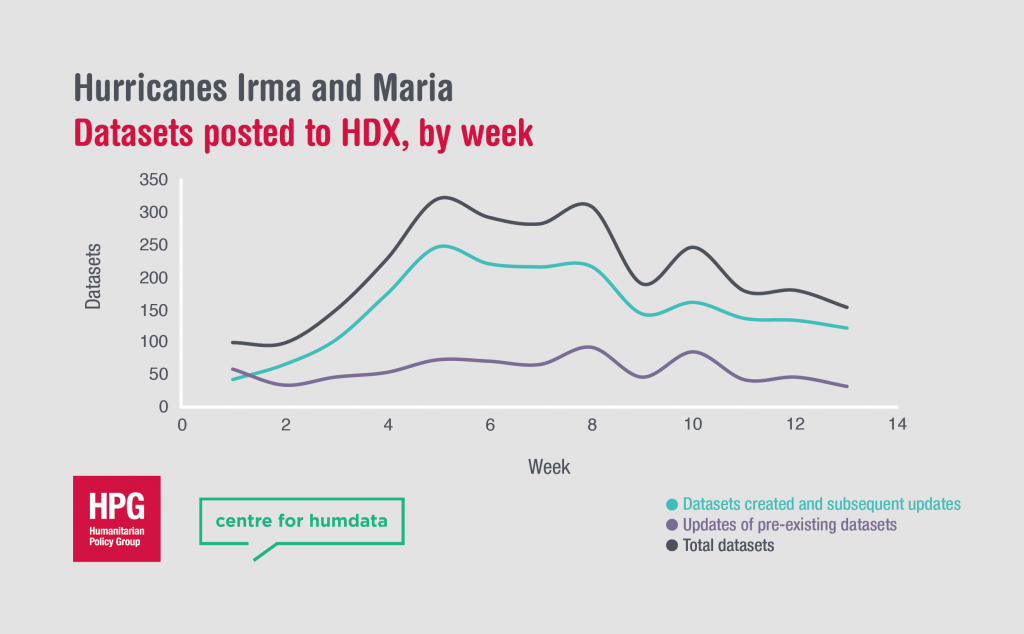
For the hurricanes, most new data was added around week five and continued at a consistent rate until week eight. This is similar to what we found with the Rohingya crisis, where new data peaked at week four and continued until week nine.
Currently, the most commonly-created and updated datasets relate to infrastructure (administrative boundaries or the location of buildings) and funding data. The sources include Humanitarian OpenStreetMap, the OCHA-curated Common Operational Datasets, and the Financial Tracking Service (FTS).
As data preparedness and dataset creation becomes faster and more routine, the spikes in data sharing should move closer to week one or immediately after the start of a crisis. Ideally, datasets in the future will be posted more quickly and better reflect the diversity of data needs in a crisis.
Outcome 2: Increase the number and strength of connections
Measurement: Number and strength of connections with the Centre, across categories of engagement
The second indicator measures the number and types of connections with the Centre. The points of engagement include HDX organisations, HXL adopters, programme implementing partners, training participants, and funders, among others.
A chunk of the Centre’s work is designed to build a network of engaged humanitarians with the skills to produce and use data. At present, HDX organisations and HXL adopters represent the most significant engagements for the Centre, with 285 HDX organisations and 44 HXL adopters as of July 2017.
In the coming years, the Centre will create engagements with new and existing partners in its work around supporting data literacy (training participants) and data policy (data sharing agreements). Ideally, as these engagements increase in strength and number, the connections will increase not only with the Centre but also directly between partners who comprise the humanitarian data ecosystem.
Outcome 3: Increase the use of HDX
Measurement: Number of HDX users (organisations, unique users, dataset downloads, dataset shares, ratio of field to headquarters users)
Finally, much of the Centre’s work supports HDX and HXL as foundational elements of data sharing and use in humanitarian crises. The Centre does not track individuals who are downloading data. But we do know that, as of July 2017, 223 organisations shared at least one dataset on HDX, with 113 of these sharing both public and private datasets. Fourteen HDX organisations shared more than 100 datasets, and 903 datasets on HDX include HXL tags. In the three months prior to July 2017, the average number of weekly resource downloads reached just over 9,000 – 9,252 to be exact. Over time, expect these numbers to continue to grow.
Some Final Thoughts
First, the Centre’s data services and support will result in improvements in data products and ease of use. Integrating HXL, for example, makes it easier to combine datasets, while automated tools can create data products more quickly. In other cases, data efficiencies may be due to efforts by other organisations to improve data collection, quality, or use. These data pathways, however, illustrate the complexity of data collection, management and use in the sector, in which the Centre is only one of many players in the humanitarian information management ecosystem.
Second, the Centre is focused on data so it follows that the team is using data to measure its results. The quantitative indicators above are important metrics yet they provide limited insight into the ways the Centre may be affecting humanitarian outcomes. Qualitative approaches such as documenting impact stories or examining specific data blockers and facilitators would improve future assessments of how the Centre is helping to reshape data collection, management, sharing, and use in the humanitarian sector.
For more information about this research, you can contact me through the ODI site. You can also reach out to the Centre team through centrehumdata@un.org or @humdata.