Share
At the end of 2018, the Centre marked its first year of operations. We published two blogs on our takeaways and highlights, which included updates on the Humanitarian Data Exchange (HDX) platform.
While HDX has had tremendous growth in the number of users and datasets being downloaded, the strength of the platform lies in the fantastic organizations that share their data with our community. For that reason, I thought it would be useful to take a closer look at some of their contributions.
Sixty organizations joined the platform in 2018, bringing the total number of organizations on HDX to over 200. (An organization can be a legal entity or an informal working group at a global or local level). Together, all organizations added 1,940 new datasets to HDX over the year, a 38 percent increase from the end of 2017 (6,288 vs 8,221 datasets). It is worth mentioning that 25 of these 200 organizations are sharing data programmatically through an API.
One change we made in July 2018 was to remove inactive organizations from the platform. Only organizations that have shared at least one dataset now appear in the list of organizations (see visual below). UNHCR, UNOSAT and Humanitarian OpenStreetMap Team continue to be the most active organizations on the platform with 1922, 722 and 694 datasets respectively.
The interactive graph above shows the cumulative growth in the number of organizations on HDX since it was launched in 2014. In July 2018, we removed inactive organizations from the platform.
Some of the new organizations joining HDX in 2018 included: Assistance Coordination Unit; Education and Conflict Monitor; Qatar Computing Research Institute; and the Food Security and Nutrition Working Group for West and Central Africa. We provide a closer look at their data below.
Assistance Coordination Unit (ACU) is a Syrian non-governmental organization working with donors, implementing partners and community representatives to maximize the impact of the humanitarian assistance delivered to the Syrian people. ACU has shared datasets related to winter needs in Northern Syrian camps as well as market prices at the governorate level. Explore these datasets and the interactive visualization here.
The Education and Conflict Monitor is an initiative of the Education Above All Foundation working in collaboration with its partners, including the Global Coalition to Protect Education from Attack, to collect, share and visualize data on education in conflict settings. They shared a dataset drawn from the report ‘Education Under Attack’ that contains a classification of countries based on severity of attacks on education. Explore this dataset and interactive data visualization here.
The above visualization maps the severity of education-related attacks and was created as part of the Centre’s engagement with the Education Above All Foundation.
The Food Security and Nutrition Working Group, West and Central Africa collects and analyzes data about people who are food insecure. The working group has shared analysis of data from the Cadre Harmonise across seven countries in West Africa. Explore this data and an interactive visualization here.
Qatar Computing Research Institute (QCRI) uses computer science research to develop innovative technologies for humanitarian response. This crisis computing team at QCRI shared data related to the number of people affected and missing following the Typhoon Mangkhut in the Philippines. Data was collected from messages posted on Twitter and processed using machine learning techniques. Explore this dataset and others here.
One of the ways we support organizations when they join HDX is to create interactive visualizations of their data that they share. See for instance the dashboard we created to show cash distribution in Somalia or this visualization showing the status of ongoing humanitarian response to the earthquake and tsunami in Central Sulawesi, Indonesia. Altogether, we developed 19 custom data visuals in 2018, some of them using open source libraries and in other instances using Tableau. Recently, we also added the possibility to embed multiple visualizations on an organization page; see an example from OCHA’s World Humanitarian Data and Trends dataset here.
Our field teams in Dakar, Nairobi, and Jakarta also provided support to organizations by adding HXL hashtags to their contributed datasets. HXL hashtags increase the interoperability of data and trigger the creation of Quick Charts so that users can get a sense of the data that is being provided. As of the end of 2018, 76 organizations had shared 3,400 HXL-ated datasets on HDX.
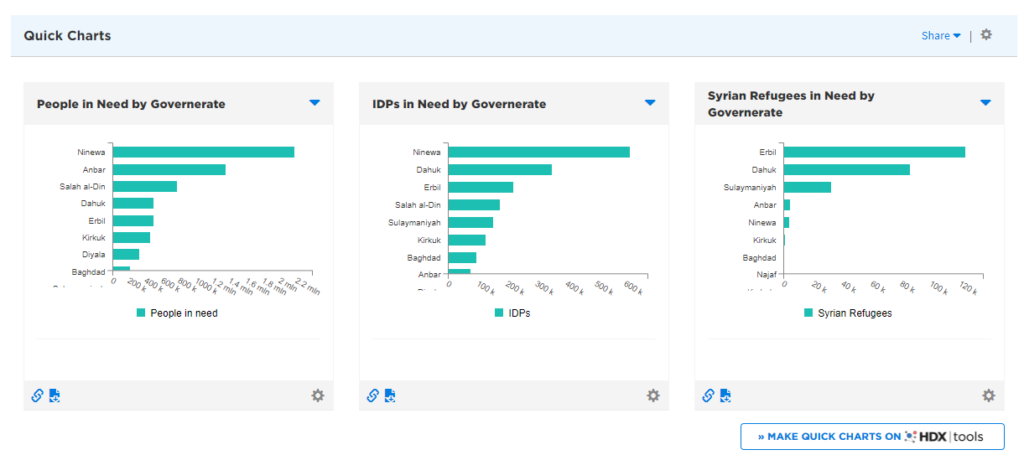
Made using Quick Charts, the visualization above is one example of how organizations are using HDX Tools and HXL hashtags to improve the interoperability of data.
I couldn’t end this blog without mentioning the continuous support that we had last year from our longstanding partners at IDMC, IFRC, IOM, JIPS, REACH, UNESCO, UNHCR, UNICEF, UNOSAT, WFP, WorldPop, and several OCHA offices. Together we improved APIs to automate data exchange, built visualizations, supported data curation, and collaborated on new features.
If your organization is interested in joining HDX, please register on the platform or write to us at hdx@un.org. You can also learn more in our FAQ. We look forward to working with you in 2019.