Share
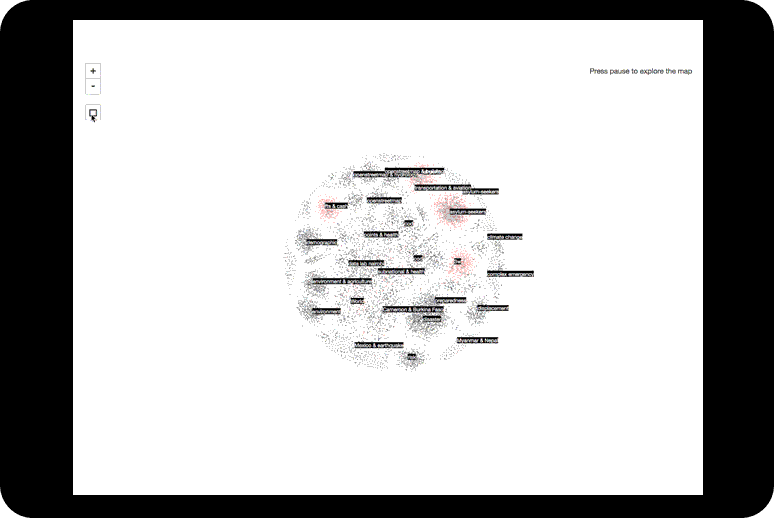
In Part 1 we looked at the top organisations that joined HDX in 2017. Here in Part 2, we examine the key user trends of 2017, and the ways the HDX community came together to share data during times of conflict and crisis. We also offer a snapshot of activities we are excited about in 2018.
HDX Users
In 2017, there were at least 20,000 active users and 120,000 page views every month. By the end of the year, there were about 6,000 registered users — an increase of 40% as compared to 2016. Registered users get extra benefits such as being members of organisations and viewing private data.
Chart 1. Number of Registered Users
HDX was accessed by users in 165 countries and territories through the year. The top countries for use of HDX vary depending on the time of year and whether there is a new crisis. For example, in October 2017, the top five countries were the US, Bangladesh, the UK, Kenya and Switzerland. HDX use in the field is very important for us. By the end of 2017, 38 percent of users were based in locations where OCHA has a field office. (For more on how we measure use of HDX, read this blog).
Chart 2. Ratio of Field to HQ Use
Data on HDX
We started 2018 with more than 6,300 datasets on HDX — 1,900 of which were shared during 2017. This is a 45% increase over 2016 and is the result of the commitment by our partners to share data about crises around the world.
Over the year, one out of four users downloaded a dataset. This proportion remained the same as in previous years, and we believe it is a strong indication that the datasets shared on HDX are relevant to our users.
Chart 3. Dataset Growth
Below are some examples of valuable data that was shared through HDX in 2017.
Hurricane Irma affected Cuba, Puerto Rico, Saint Martin and other countries in the Caribbean in September 2017. Partners shared data about population exposure, hurricane paths, wind speed zones, damage assessments and administrative boundaries. See, for example, Irma’s Damage assessments shared by the International Federation of Red Cross and Red Crescent Societies. This dataset was accessed about 600 times during the height of the crisis.
The HDX platform hosted several other high-value datasets related to natural disasters, including for Hurricane Maria, monsoon flooding in Bangladesh, flooding in Sierra Leone and the earthquake in Mexico.
In Somalia, OCHA has been sharing monthly data about how organisations are distributing cash assistance across the country. The dataset on cash flows has been downloaded 1,200 times since it was first shared in April 2017.
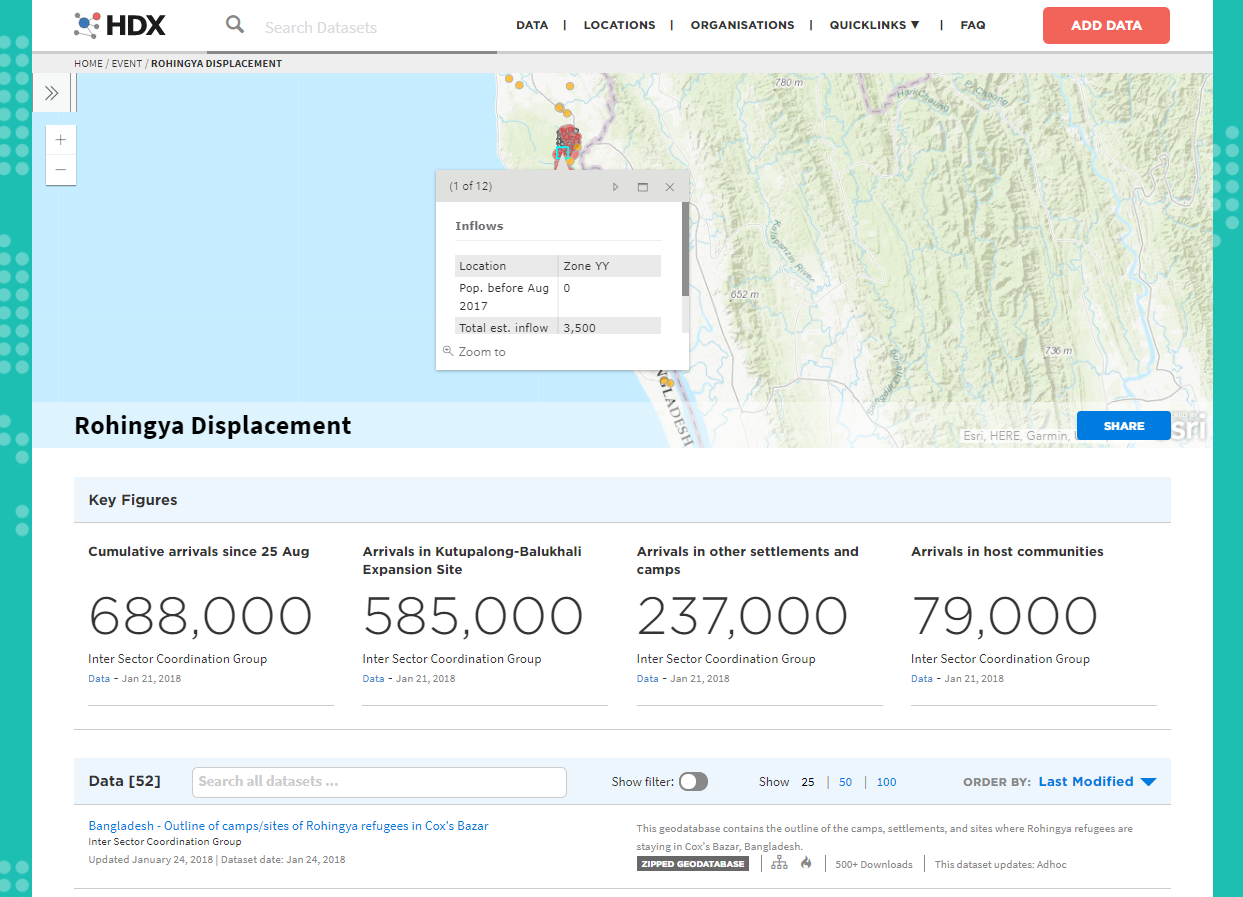
Partners have contributed about 50 datasets related to the Rohingya displacement crisis. The dataset that shows the location of Rohingya refugees in Cox’s Bazar has been downloaded more than 3,600 times.
Important datasets about the four famines in Northeast Nigeria, Somalia, South Sudan and Yemen, as well as data about the Syrian conflict and displacement in the Democratic Republic of Congo were also shared during 2017.
Plans for 2018
We look forward to working on new features to keep HDX users motivated, and enhance data sharing in the humanitarian community. Here are a few things on our list:
- HDX Tools. We will continue to make it easier for users to visualize and share data by upgrading Quick Charts and HDX Connect. We’ll also be releasing HXL Tag Assist and Data Check. Read more in our Tools Roadmap.
- Search. We will improve search so that users can find the data they need as quickly as possible.
- Data Freshness. We will be working on ways to indicate to users how ‘fresh’ data is and when new updates are expected.
- Data Completeness. We are working on a way to show what data is available and missing for countries and crises on HDX. This will give data contributors and users a sense of how complete the data is and can serve as a call to action for what is still needed.
We are grateful to the many users who provided feedback and shared datasets in 2017. Please continue to send feedback to hdx@un.org or reach us on Twitter at @humdata.