Share
If your data uses HXL hashtags, then the Quick Charts tool can automatically create customizable graphs and key figures to help you highlight the most important aspects of your dataset. Quick Charts require the following:
- At least one resource in your dataset (stored on HDX or remotely) must have HXL hashtags.
- That dataset must have the HDX category tag ‘HXL’ (not to be confused with the actual HXL hashtags).
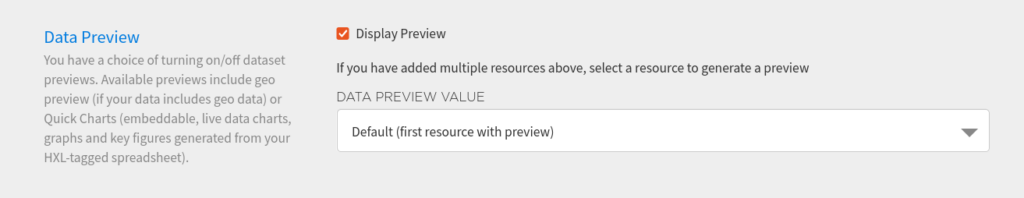
Each resource can have its own Quick Charts, but only one set will appear on the dataset page. By default, it will be the first resource that has Quick Charts attached, but you can change that to select any HXLated resource when editing the dataset.
For more details you can view these walkthrough slides:
If your data uses HXL hashtags, then the Quick Charts tool can automatically create customizable graphs and key figures to help you highlight the most important aspects of your dataset. Quick Charts require the following:
For more details you can view these walkthrough slides:
- At least one resource in your dataset (stored on HDX or remotely) must have HXL hashtags.
- That dataset must have the HDX category tag 'HXL' (not to be confused with the actual HXL hashtags).
For more details you can view these walkthrough slides: