Share
What data tools do humanitarians need to support their work? We partnered with frog, a global design firm, to survey the humanitarian-data community. In Part 2, see how we’re responding to the survey findings.
Earlier this year, we conducted field research in West Africa to understand what slows data as it moves from collection to use. That research identified a number of barriers to data flow, including uneven knowledge among data workers and inadequate data processing tools. We began to explore opportunities for HDX to add value through a new, easy-to-use tool workflow that would help users to add Humanitarian Exchange Language (HXL) hashtags to datasets and automate many aspects of data cleaning and visualization.
We ran the survey to better understand the current tool ecosystem and to gauge the appeal and perceived value of the HDX Tools offering. The survey introduced the following tool concepts:
- Quick Charts – Instant, simple charting for single datasets
- Quick Maps – Easy, visual mapping with multiple datasets
- Data Check – Rule-driven error checking for humanitarian data, supporting existing workflows
- Data Remix – Combining, modifying multiple datasets (database-like control without the database)
- HXL Tag Assist – A module for helping users add the right HXL hashtags to their data
Survey Response
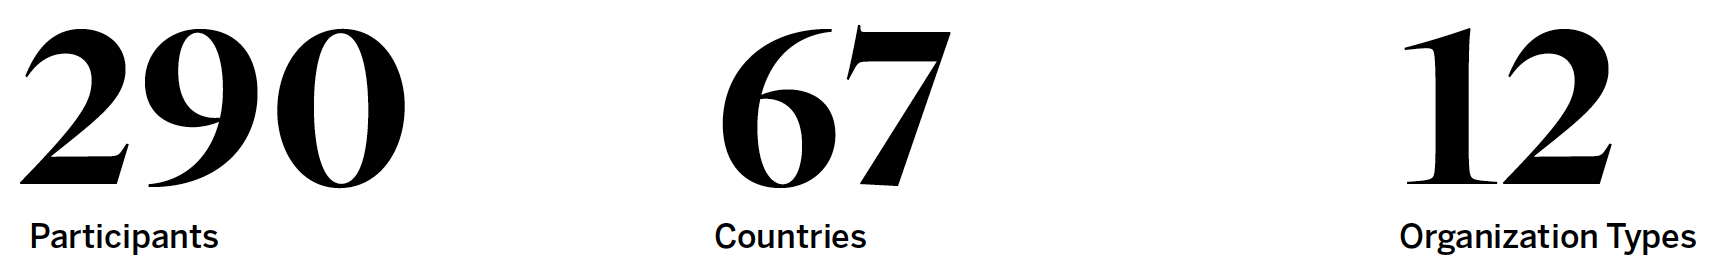
The response to the survey was encouraging, both in the number of respondents and in the variety of countries and organisation types represented:
Here’s a look at what we found.
HDX Tools
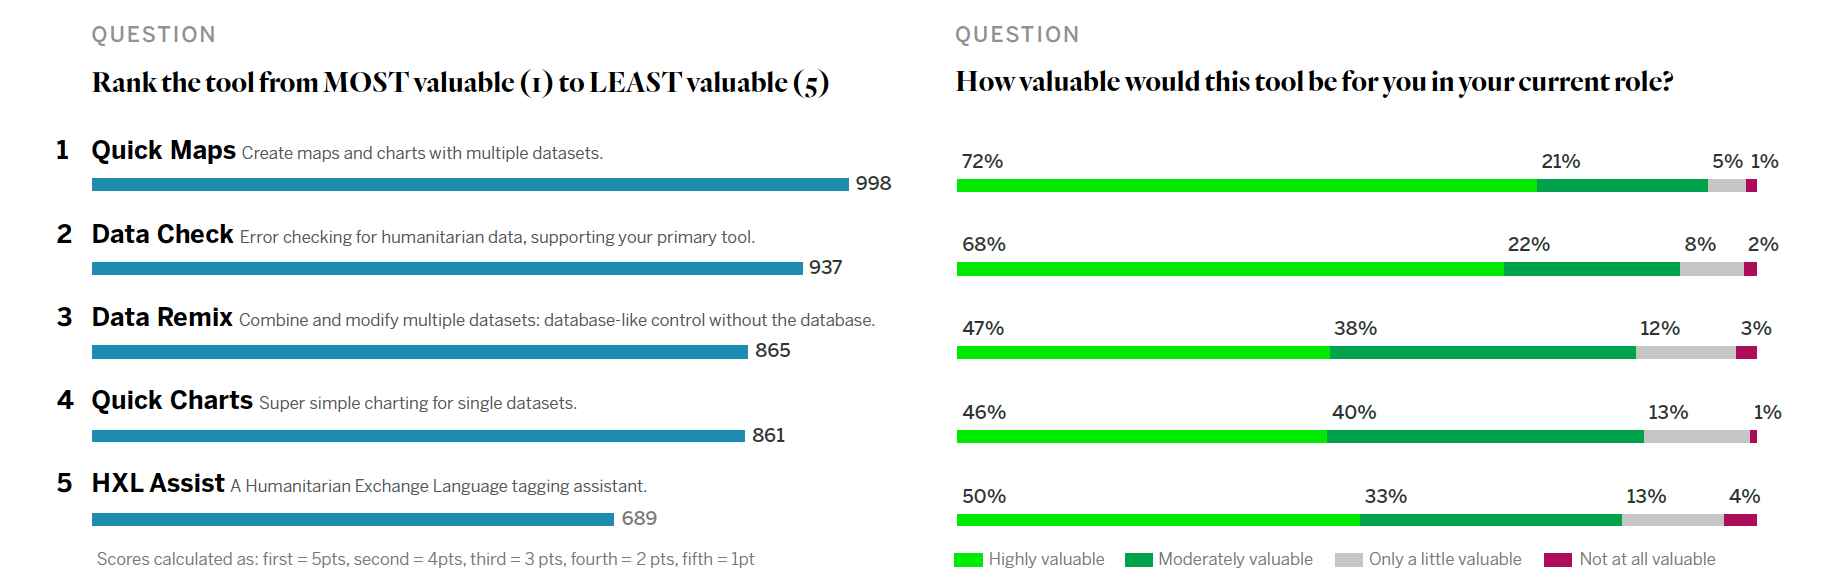
All proposed tools are valuable, but Quick Maps and Data Check won out. Results were overwhelmingly positive: on average 87 percent of respondents found the tool concepts either moderately or highly valuable. In fact, 83 percent high-to-moderate value was the worst assessment a single tool received. Conclusion: HDX Tools should fit well within the ecosystem of tools used by respondents.
HXL
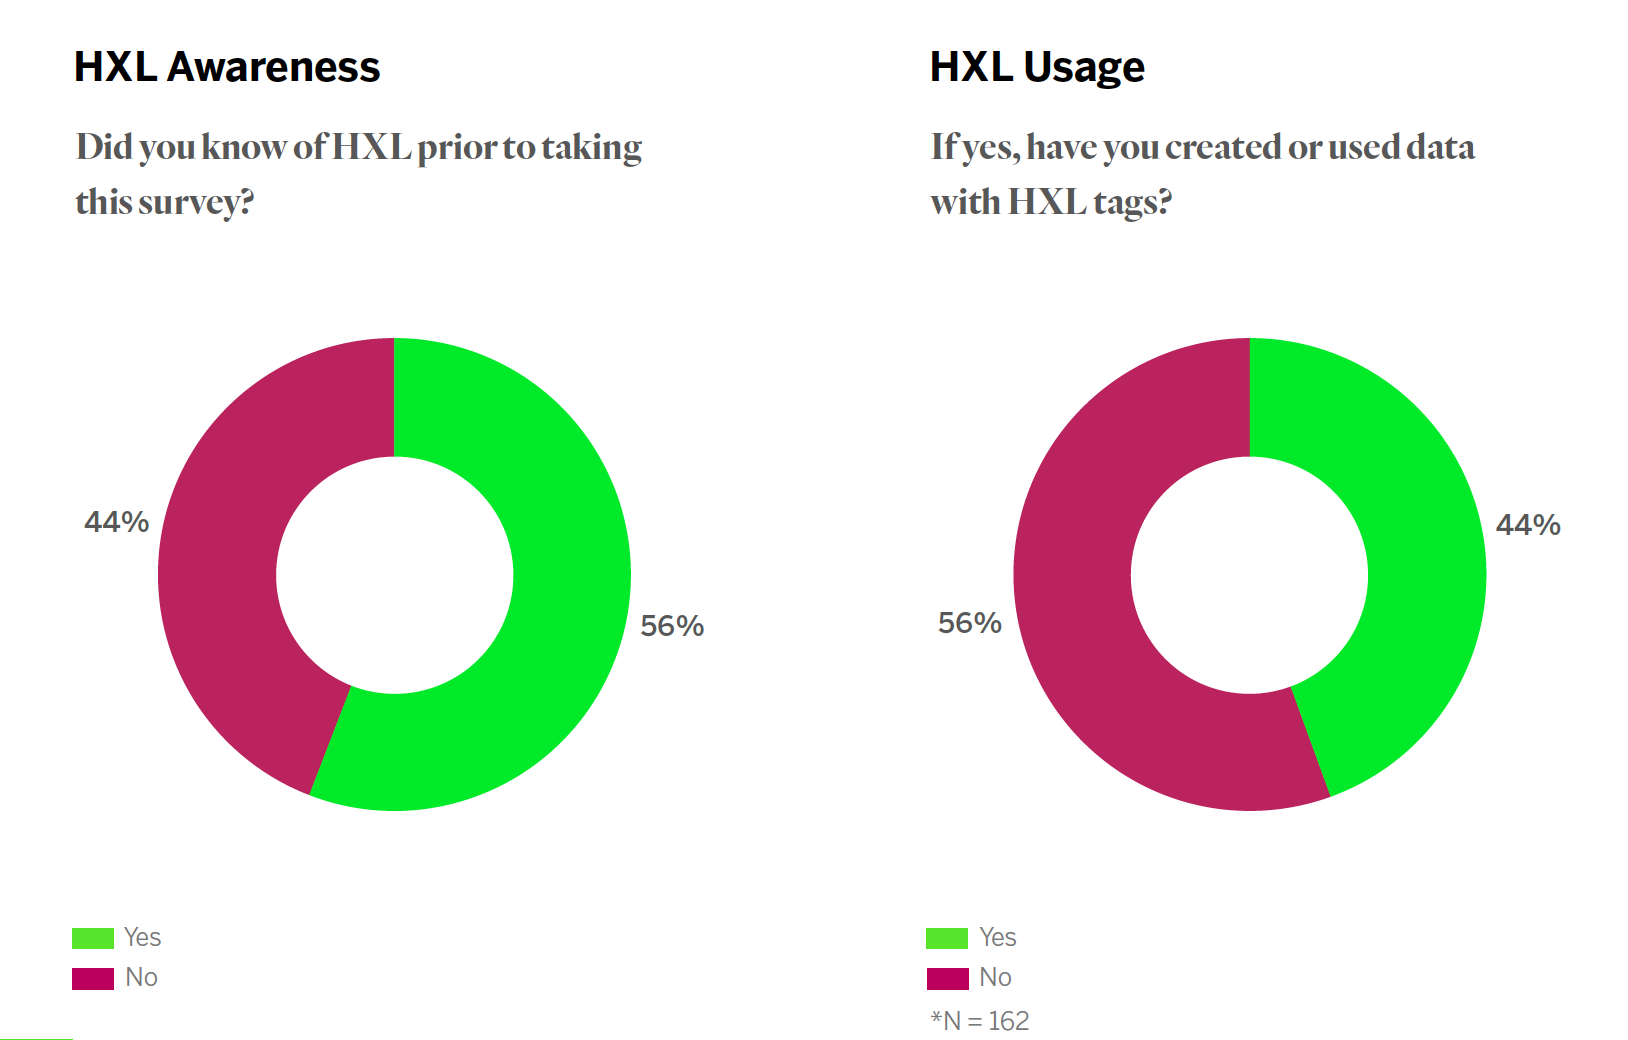
Data people have standards. HXL works by adding hashtags to the top of columns in (mostly) spreadsheets, to make it easier to combine data from many sources. As it turns out, many of you see value in HXL adoption, even if we’re not yet seeing that interest turn into action. HXL awareness is surprisingly high among respondents, but most haven’t used it. Over half of respondents (56 percent) were aware of the HXL standard, and 44 percent of those respondents said that they had used it. Most respondents (88 percent) were interested in adding HXL hashtags to their data to gain access to data-sharing tools. Conclusion: HXLation is an acceptable cost for access to HDX Tools.
Data Practices
The spreadsheet is still king. The spreadsheet is still the backbone of humanitarian data collection and management. Of the survey’s 290 respondents, 275 use Microsoft Excel as a core data tool and 194 use Google Sheets. Dedicated mobile data-collection applications like Kobo are gaining ground, but simplicity, functionality and shareability keep spreadsheets the preferred method. According to survey respondents, using programs like ArcGIS for geospatial work (142) and Adobe Illustrator for building visualisations (136) ranks high, but leads to static artifacts. Conclusion: The assumption that spreadsheets are ubiquitous held true.
Home is where the cloud is. The cloud is unbeatable for its storage capacity and accessibility across geographies, which is why humanitarians often keep their data in the cloud. According to results, only 3 percent were prohibited by their organisations from using any kind of cloud services—even private ones—for security reasons. Among cloud users, 32 percent most often use Google Drive, 25 percent use Dropbox and 12 percent use Microsoft 365. Conclusion: Cloud-hosting is a reasonable requirement for HDX Tools.
What’s Next?
In Part 2, see how we’re responding to the survey findings from Sarah Telford, Head of HDX. For a closer look at the results, see the HDX Tools survey summary slides below.