
Partners:
WFPCentre Service:
Data ServicesTags:
Summary:
In August 2017, WFP requested support for data services in the Republic of Congo (also referred to as Congo or Congo-Brazzaville). Displacement in the Pool region had generated data that needed to be cleaned and combined to create a common picture of the needs. An HDX Data Manager, normally based in Dakar, deployed for two weeks in early September and while there, worked with partners to process data and create a visualization about the crisis.
Challenge:
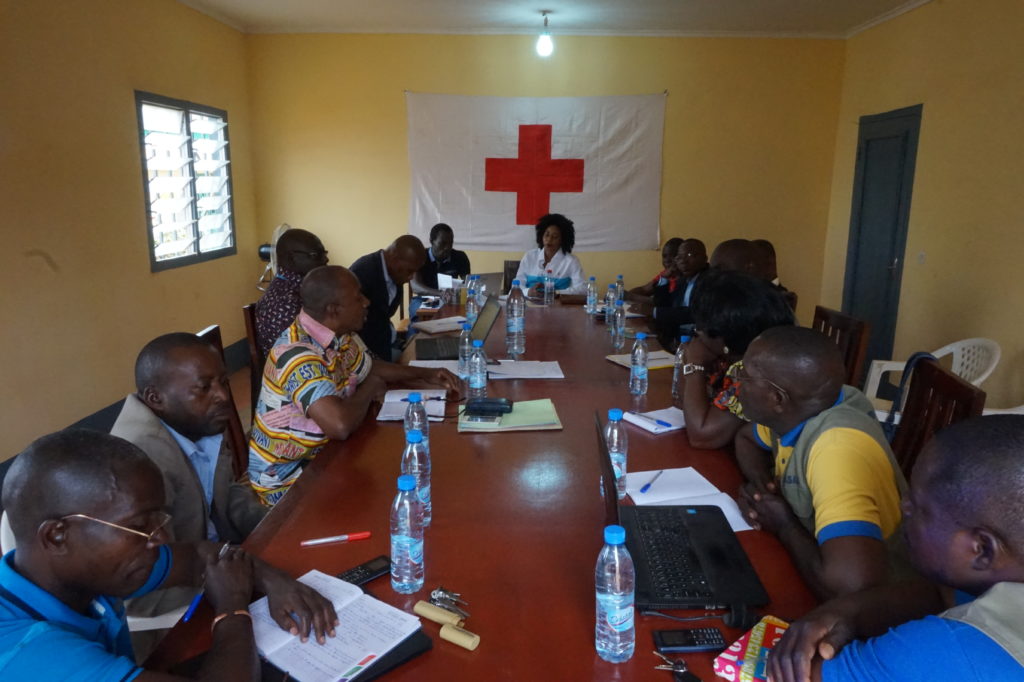
In July 2017, the UN declared a humanitarian emergency in the Pool region of Congo. This region, south of the capital Brazzaville, was the scene of violent confrontations between rebel forces and the army. The Ministry of Social Affairs and Humanitarian Action (MASAH) and its partners including UN agencies, the Red Cross and CARITAS, were carrying out registration and census operations for displaced persons in the affected area. Access was challenging due to security constraints. Data was being collected by a number of partners and was difficult to bring together to get an overview of the situation.
Centre action:
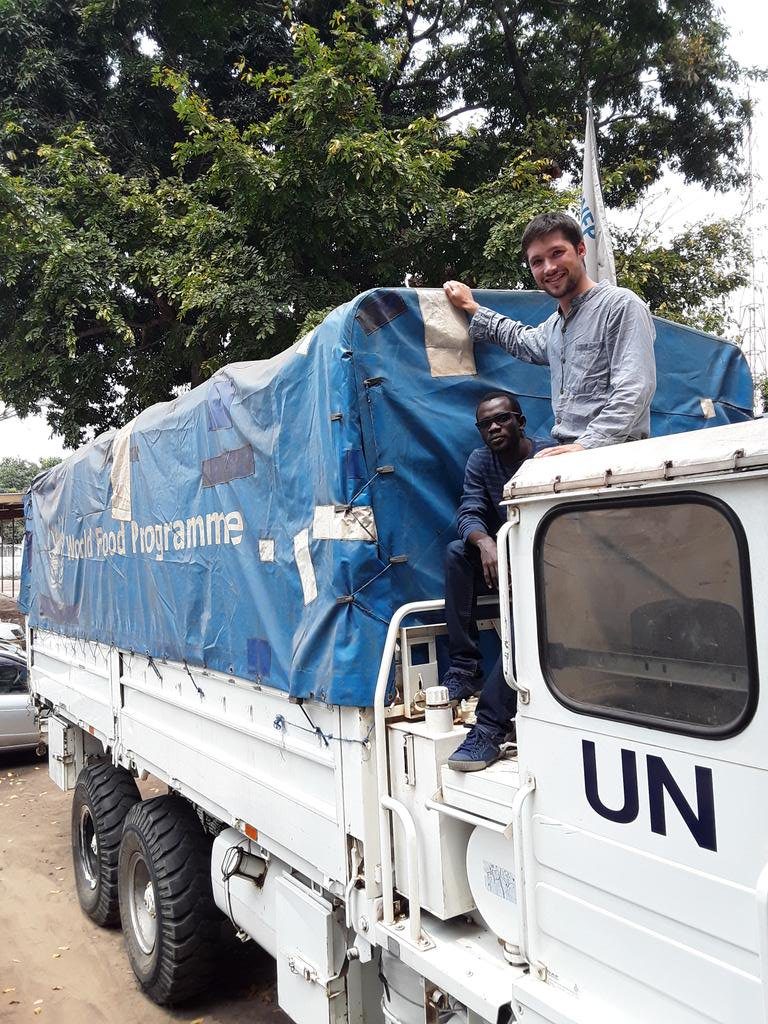
The Centre worked with WFP to understand their request for support and the wider context of the crisis. We deployed Amadou Ndong, an HDX Data Manager, from our lab in Dakar for a two week period. Amadou was joined on this mission by a WFP mVAM (mobile Vulnerability Analysis and Mapping) staff member from Rome.
Once in country, the focus was on identifying the processes and actors involved in the data workflow, from initial collection to dissemination. MASAH and its partners had already collected significant amounts of data. Each organisation had its own data, but there was no overview of all the data, and there was not enough coordination to bring it together. Amadou worked with individual partners to understand their data and supporting processes. He combined data from many sources so that it could be visualized.
Outcome:
The most important aspect of the project was bringing skilled actors together and creating a team that could lead data processing going forward. The team created a dynamic, interactive visualization to help MASAH and international responders understand and query the data. The final product provides an overview of the number of displaced persons across four regions and 15 localities. The data is disaggregated by age, gender, and place of origin and residence.
All in a day’s work: new #dataviz by @ndongamadu illustrates crisis data in Republic of #Congo . pic.twitter.com/WlL6yeZfqO
— Jean-Martin Bauer (@bauer_jm) September 15, 2017
Conclusion:
This collaboration demonstrates the importance of data coordination between local ministries and humanitarian partners. A boost of technical support can help put in place a resilient process for collecting and managing data from many sources. Interactive visualizations make data accessible to non-technical audiences and supports decision making.