Share
The number of datasets on HDX is growing by about 40 datasets per week on average. As of May 2019, almost 9,000 datasets have been shared by partner organizations covering every crisis in the world. This is a tremendous achievement for collective action but it has come with a downside: the right data can be hard to find.
We have created a new feature called the ‘Data Grid’ to help users in their quest for good and relevant data. Based on interviews with our users, the Data Grid places the most important crisis data into six groups: affected people; coordination and context; food security and nutrition; geography and infrastructure; health and education; and population and socio-economic indicators.
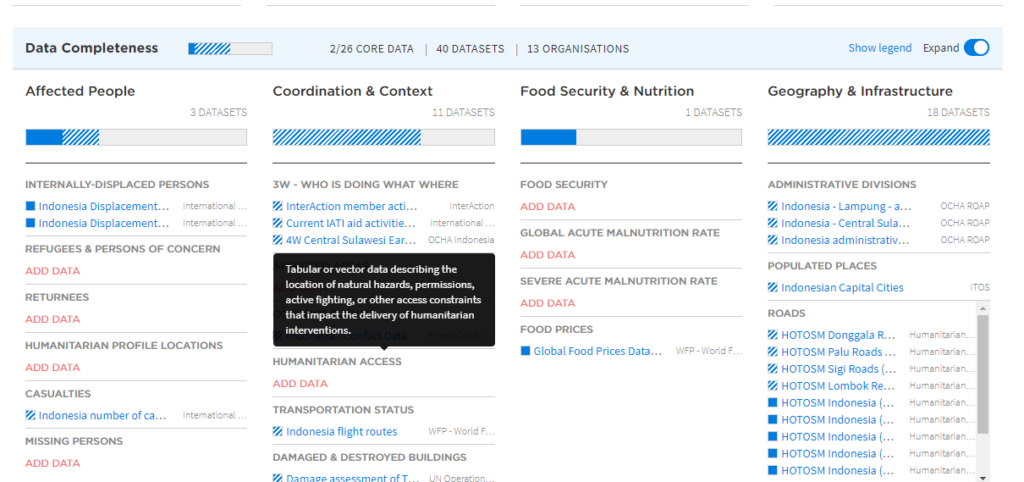
Within each group, there are a subset of categories. For example, within the affected people group, there are categories for internally displaced people, refugees, returnees, and casualties, among others. These initial categories can be customized over time to reflect and respond to unique crisis contexts. During an earthquake response, data about shake intensity will be important; for a flood response, data about inundated areas is critical.
Relevant crisis data is included in the Grid if it is disaggregated beyond the national level, is in a commonly-used format, and is the latest available (see more details below).
The ‘right data’ will greatly depend on who is looking and what they are looking for. A dataset might have the right data, but not cover the part of the country needed. Or it might cover the right geographic area but be in a format that is difficult to work with.
Using the Data Grid
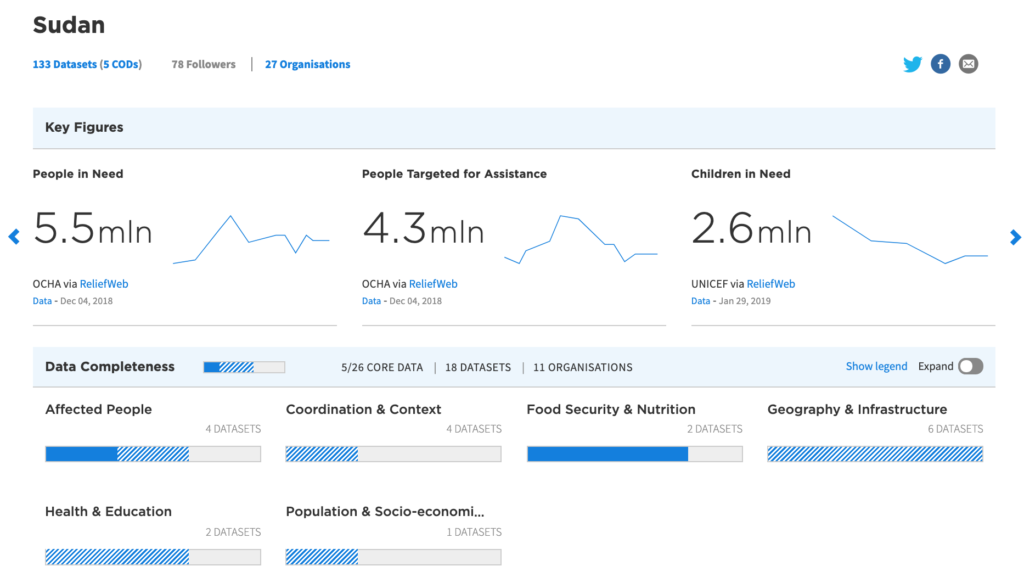
Data Grids appear at the top of HDX Location Pages. There are currently 14 Grids available: Afghanistan, Bangladesh, Central African Republic, Chad, Colombia, Democratic Republic of the Congo, Indonesia, Mozambique, Myanmar, Philippines, Somalia, Sudan, Venezuela and Yemen. Select the ‘expand’ button to see the full Grid.
Each Grid includes a ‘Data Completeness’ progress bar along with the number of datasets included. Datasets that fully meet the criteria of a category are shown with a solid blue square to the left of the dataset name; those that only partially meet the criteria are shown with hashed blue-and-white square. Hover over the dataset name to see the limitations of the dataset. Hover over the category name to understand the criteria for inclusion.
Measuring Completeness
All datasets on HDX are evaluated against the following criteria for inclusion in the Grid:
- Is the data in a common format? We include CSV, XLS, XLSX, SHP, etc. Formats like JSON, geopackage and others that are more difficult for the typical humanitarian data specialist would be marked ‘incomplete.’
- Is the data tidy? Field names and data rows should be easy to determine. There should not be subtotal rows interspersed with data rows. The required data for the category should be in a single table on the same tab. For tabular data with coordinates, the x and y columns (usually longitude and latitude) should be in decimal degree format and separated into two columns.
- Are location references defined? The dataset should contain explicit geographic data (as in GIS data or tabular data with lat/long fields)? If not, the dataset should be joinable to an available dataset that defines those locations.
- Is the dataset comprehensive? If the dataset is disaggregated by administrative divisions, does it cover all of them? If it does not, is the meaning of a missing administrative division defined in the metadata? If there is no comprehensive list to compare against (for example with spontaneous displacement locations), does the dataset make it clear if it attempts to be comprehensive or not?
- Is the dataset up-to-date? The dataset should be the latest available.
When a dataset is added to HDX, it may be automatically added to the Data Grid based on its metadata tags. However within one day, an HDX team member will evaluate the dataset to determine if it sufficiently meets the criteria to remain in the Data Grid.
Current Status
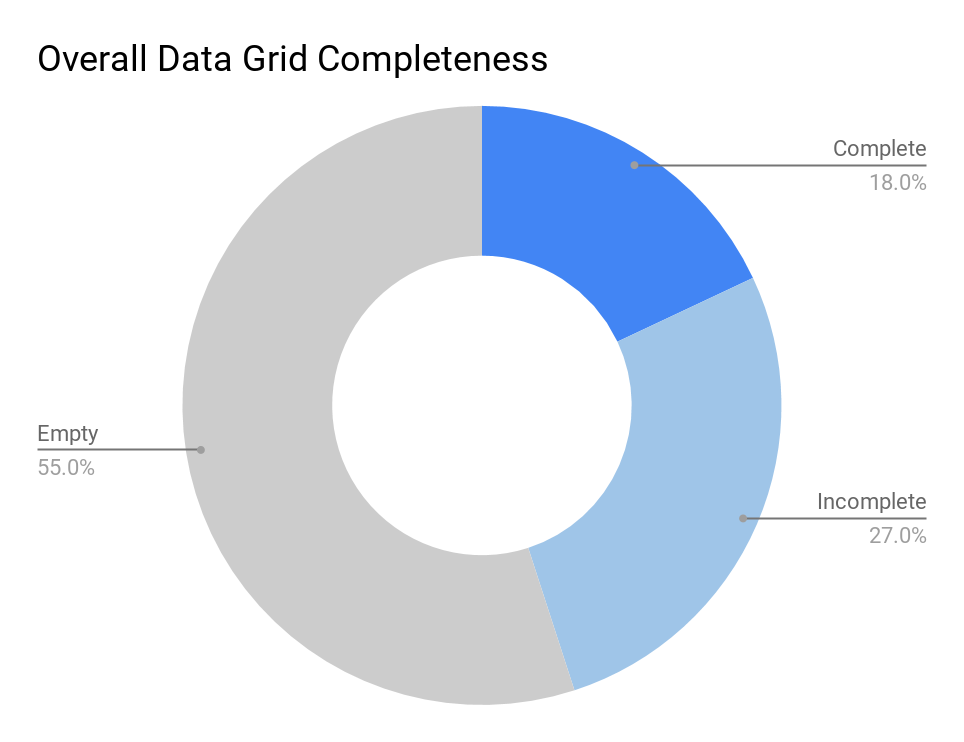
As of April 30, the completeness of all Data Grids combined was 18%. That is, 18% of the Data Grid categories, across all 14 countries, had a dataset on HDX that fully met the criteria. If we also add in those datasets that partially meet the definition, completeness climbs to 45%, leaving 55% of the Data Grid empty (no dataset even partially meets the definition).
Feedback
We would appreciate feedback on the Data Grids, including:
- Are the main groupings the right ones?
- Do the categories make sense for each group?
- Are any categories missing that are essential for humanitarian response?
- How might we use the Grids to create a call to action for filling the gaps?
We are also exploring how to share the work of curating the Data Grids with those people who are closer to the operations. We are planning a pilot with MapAction soon to test remote curation support. If the Data Grid is useful, we may also explore automating the curation process based on HXL.
“MapAction is very excited to work on the Data Grid. The Grid shows the availability and quality of data, driving access to information concerning the affected area and leading to actioning the gaps in information needed to respond.”
-Rob Hines, Operations Director, MapAction
Thank you to the partners who participated in the design research and provided feedback on initial versions of the Data Grid. And special thanks to our partners at Oblo for their work on the research.
This is great! I do suggest adding a field for temporal data that identifies the time of the data. Administrative boundaries are a prime example. The district boundaries in Uganda have changed a number of times in the past 20 years. Stealing from the US Census Bureau and CDC, we call it “vintage “. As in the “2005 vintage district boundary of Uganda “. It can apply to things like population projections.
Given the rapid increase in the number of data files you have, you are going to need a professional data archivist very soon!