Share
The United Nations World Food Programme (WFP) has long been a valuable partner of the Humanitarian Data Exchange (HDX), supplying food prices and food security data since the platform was first launched in 2014. In the past, the process for uploading the data was manual and was kept in a single global file. Following a fruitful collaboration between WFP and HDX, the data is now updated automatically and disaggregated by country. The food price data has also been enhanced with Humanitarian Exchange Language (HXL) hashtags which allows for automatic visualisation with Quick Charts.
This blog was co-authored by Mike Rans, Data Scientist with HDX; Tobias Flaemig, Head of Economic and Market Analysis, WFP VAM; and Inga Sagolla, Consultant, WFP mobile Vulnerability Analysis and Mapping.
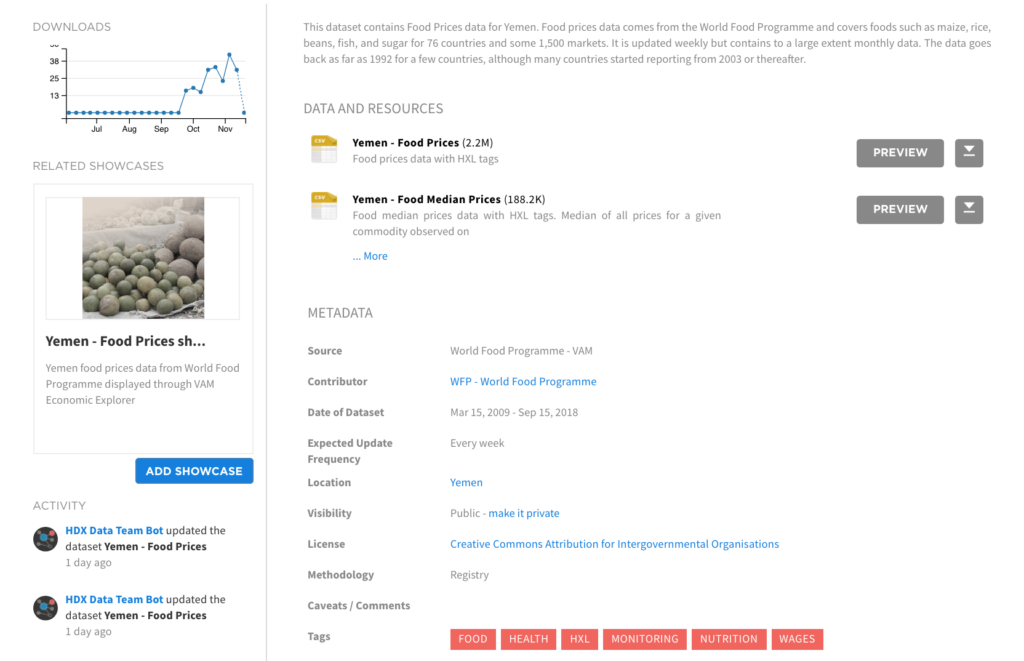
Yemen food price dataset on HDX
WFP’s Vulnerability Analysis and Mapping
Assisting more than 91 million people in around 80 countries each year, WFP delivers food and food-related assistance in emergencies and works with communities to improve nutrition and build resilience.
Prior to any intervention, WFP needs to undertake an analysis of the food security situation in the area and answer some critical questions: Who are the food insecure or vulnerable people? How many are there? Where do they live? Why are they food insecure or vulnerable? What should be done to save their lives and livelihoods? How is the situation likely to evolve and what are the risks threatening them?
A unique network of 200 analysts around the world seeks to provide answers to these key questions, guiding WFP’s food security analysis work, commonly known as Vulnerability Analysis and Mapping (VAM). VAM provides geospatial and economic analysis, food security monitoring and assessments, post-shock assessments and thematic analysis. The information VAM supplies allows WFP to perform effective targeting, determine the most appropriate type and scale of intervention (e.g. food distributions, school feeding, cash or voucher programmes), and ensure the most efficient use of humanitarian resources by allocating funding according to needs.
Open data is a key principle for WFP, and VAM endeavours to make all the food security data it collects as “open” as possible in order to provide the most accurate and timely information. The latest food security data, publications, and analytical tools are freely available online at the VAM One Stop Shop.
VAM also has a data visualisation platform at dataviz.vam.wfp.org where users can explore economic and seasonal data, browse interactive reports and access thematic dashboards. Providing data related to food security to HDX is equally important in order to enable individuals working in the humanitarian sector to find the data they need all in one place.
Increasing the speed of data: from the field to WFP to HDX
One of the objectives of the Centre for Humanitarian Data is to increase the speed of data. This collaboration demonstrates some of the ways in which it is working to make this a reality. The following provides a step-by-step breakdown of the data flow.
1. From the field to the WFP corporate price database
WFP staff and local partners including government institutions collect and provide food price data to WFP in countries around the world. The data is compiled in predesigned Excel templates that minimize data entry errors and control for quality through an off-line application. The files are then uploaded into a database. The upload process ensures that we do not create duplicates, mix prices across countries, or report a price for a 50kg bag of rice as one for 500 grams. The data points usually have a monthly frequency; however, WFP is currently in the process of updating the system so as to better integrate also weekly or higher frequency data.
2. Automating the flow of food data out of WFP
A considerable achievement and crucial first step in the flow of data from WFP to HDX was the release of food prices and food security data through the Application Programming Interfaces (APIs) developed by WFP VAM. An API provides a means for external users to retrieve data from WFP databases in a standardised form by creating a url and adjusting its parameters, making this essential data much more accessible than before. One of those parameters allows the disaggregation of data by country, which is useful for data managers and policy makers to understand trends.
3. Ensuring WFP datasets in HDX are regularly updated
With WFP’s data readily accessible, the next step was to bring that data into HDX, creating a dataset for each country for which there is data available. Scripts were created to run on a server, uploading files on a regular schedule to HDX. These scripts use the HDX Python API, a well-tested library with a high-level of code coverage that enables easy interaction with HDX in Python (detailed documentation here).
4. Adding HXL hashtags to WFP food prices
HXL hashtags were added to the food prices data to increase interoperability and insight. The hashtags create opportunities for connecting this data with other datasets on HDX to build dashboards and visualisations. A simplified sample of the data is shown below.
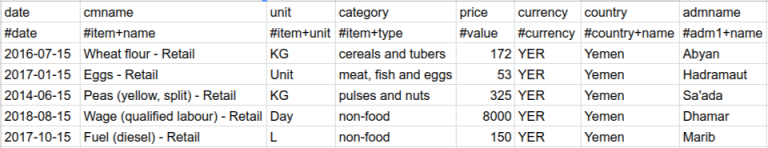
The second row of the WFP data contains the HXL hashtags that enable interoperability between systems.
Visualising the data
Global food prices
WFP’s organization page on HDX includes a visualisation showing all of the countries with food prices data. Users can select a country and explore the price trend of various commodities by geographic location. We built this visual a few years ago and it is among the most popular on the platform. Since the data is now updated automatically, it will always be in sync with WFP’s database.
Global food prices visual on WFP’s organization page
Quick Charts
HDX has created a set of tools that help users do more with HXL-tagged data. One of them is Quick Charts which are automatically-generated, live, embeddable visualisations, including bar, pie, or line charts, and key figures, all driven by a dataset on HDX (or even elsewhere on the web).
The usual approach to creating Quick Charts would be to refine the graphs that are automatically activated when HXLated data is uploaded to HDX. In many cases, this will be sufficient to produce reasonable charts. However, for the WFP data, we created a specific recipe for what we wanted to chart.
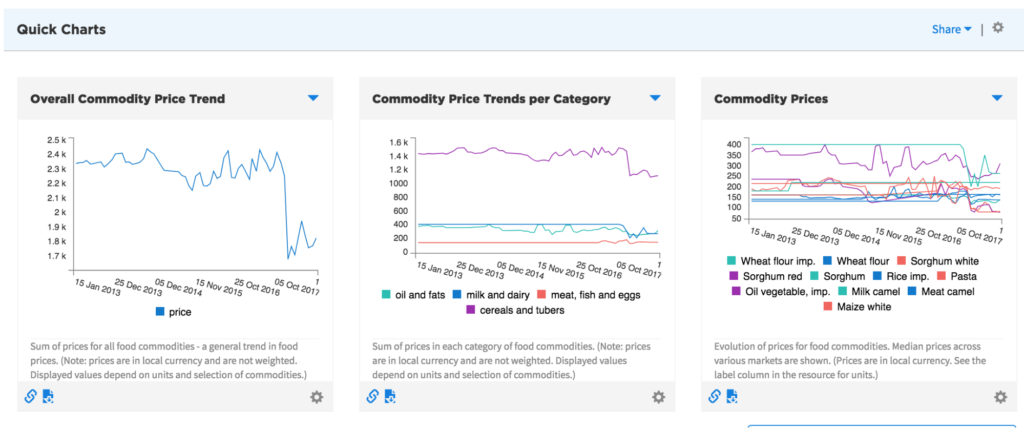
Quick Charts of Somalia food prices
Note that the graphs are a simplification of the WFP data, their purpose being to encourage exploration and deeper analysis. As such, prices are shown in local currencies rather than USD and are nominal, and therefore do not account for factors like inflation.
Linking to WFP’s visualisations
For more sophisticated and customisable graphs than what Quick Charts can provide, the data on HDX includes links to visualisations hosted on WFP’s VAM site. This includes the ‘Economic Explorer’ which is available for each country and shows market trends and prices.
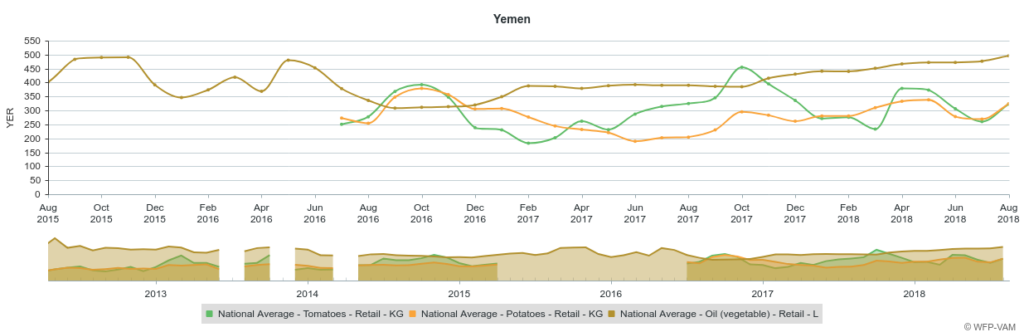
WFP’s Economic Explorer for Yemen
The VAM DataViz site also includes interactive dashboards such as the quarterly Market Monitor where users can drill down into further analysis on food price data.
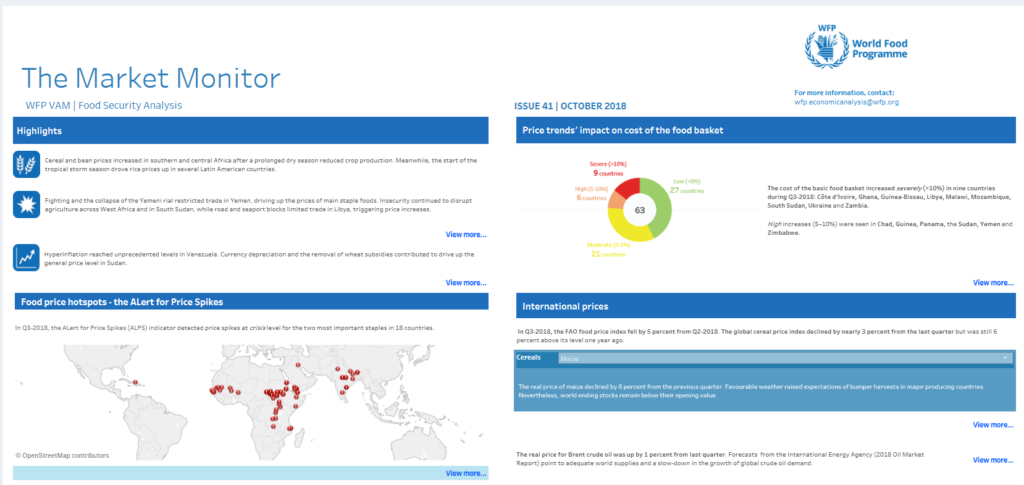
The October 2018 Issue of the Market Monitor
Feedback
Let us know if this work has been useful and what improvements you would like to see. If you are interested in taking a similar approach to sharing your organization’s data on HDX, we would be happy to help. Queries, ideas and feedback are always welcome at hdx@un.org.
For more information about WFP’s Vulnerability Analysis and Mapping work, its data and assessment methodology, please visit http://vam.wfp.org/. If you would like to explore thematic dashboards, economic and seasonal data, interactive reports, and the Hunger Analytics Hub, head to http://dataviz.vam.wfp.org/. You can also provide feedback directly to WFP at wfp.economicanalysis@wfp.org.
