Share
Communicating the urgency of climate change is essential, and for humanitarians, it can make a difference in the lives of the world’s most vulnerable people by driving policy change or raising funds. During my fellowship with the Centre, I developed ‘A Race to Adapt’, a data story about the climate crisis in the Sahel. It combines quantitative analyses with a narrative about a Chadian girl’s daily journey to collect water for her family. Below I provide details on my process and suggest recommendations to help humanitarian organizations make the most of data storytelling in their work.
Step 1: Research and Data Hunting
I began my research by reviewing several reports published by humanitarian organizations on the topic of climate change to better understand the context and identify potential sources of data. I then interviewed colleagues in field locations as well as those at headquarters working on communications, data and climate change to understand their perspectives.
After identifying key issues linked to climate change in the Sahel, I searched for datasets on the Humanitarian Data Exchange. While there is still only limited data available about climate change risks and impacts in humanitarian settings, I was able to find a few datasets that informed the rest of my work. These included disasters over time from the Centre for Research on the Epidemiology of Disasters (CRED), the country index from the Notre Dame Global Adaptation Initiative, and food insecurity in West and Central Africa from Cadre Harmonisé and the Integrated Food Security Phase Classification.
Step 2: Analysis and Story Development
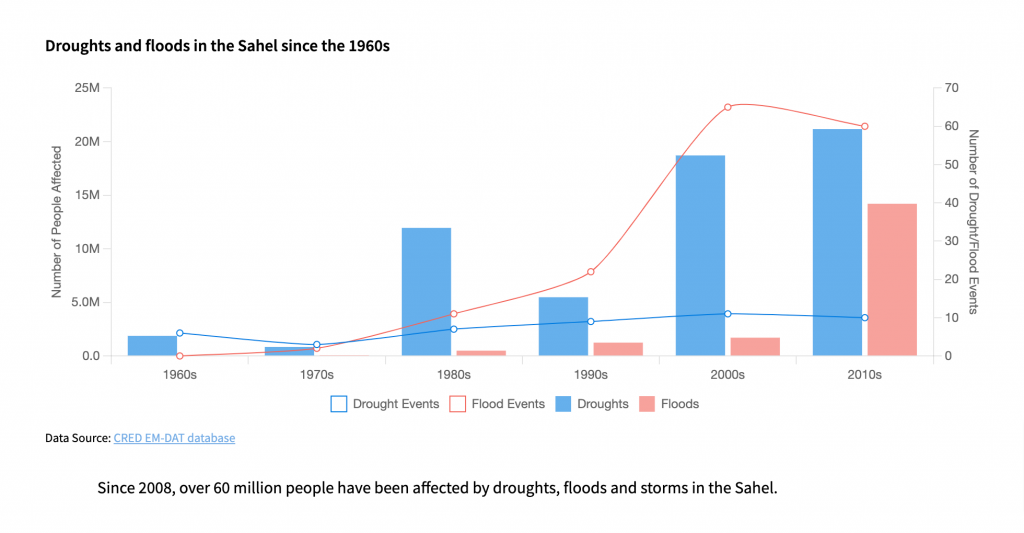
Once I selected the most important datasets, I did some data cleaning using R’s Tidyverse collection. I then did some exploration and analysis using Observable Notebook. For example, I explored CRED’s disasters dataset to look for trends, and found that many climate-related disasters in the Sahel, such as droughts and floods, have increased over the last two decades.
To complement my quantitative analyses, I read stories about how people in the Sahel are affected by climate change. I also spoke with colleagues in the OCHA office in Dakar to understand common experiences of individuals and families in the region. We ultimately developed an abstracted narrative by piecing together several different stories that relay the experience of one girl’s daily journey to fetch water in Chad.
Zara’s journey from her village to the nearest water source illustrates a number of problems related to climate change and its impacts on communities in the region. This includes displacement, dwindling water supplies from drought, destroyed farmland from migrating livestock, and increased food insecurity and malnutrition. For each step, there is an option to explore the data in more detail.
The data story ends with a call-to-action that encourages the reader to learn more about how communities around the world are adapting to climate change, and to donate to the UN’s Regional Humanitarian Fund for West and Central Africa.
Step 3: Design and Development
My approach to the data story builds on the creative concepts of the Centre’s previous data stories but introduces a new structure. Rather than moving from one location to another on a map, my story uses images and data visualizations to guide the reader through the journey of the protagonist.
I found photos on OCHA’s smugmug repository and created complementary visual assets to give the story an immersive experience. I developed prototypes iteratively in Adobe Illustrator and Figma in order to refine the concept and seek feedback from my target audience. Finally, colleagues at the Centre implemented the concept through frontend development using HTML, CSS, Javascript, D3 and Mapbox.
Recommendations
Based on my fellowship experience, I believe humanitarian organizations can make the most of data storytelling by considering the following:
- Get iterative feedback from your target audience and domain experts throughout the process;
- Ground the story in human experience but back it with evidence and data-driven insights;
- Help the audience stay focused by keeping the main narrative short and by offering options for more details.
* * * * *
Learn more about the 2021 Data Fellows Programme and watch the video of the Data Fellows Programme Showcase. The new roles for our 2022 programme will be announced in February or March 2022.