Share
The Centre talked to the team from the Information Management Unit in OCHA’s Regional Office for West and Central Africa, based in Dakar. We discussed their work to consolidate data about different countries and crises in the region, why standard formats and processes help, and took a closer look at their latest interactive visualization on the Lake Chad Basin crisis.
The interview was conducted in late April by Sarah Telford, lead for the Centre for Humanitarian Data. The IM team included Robert Colombo, Oumou Khayry Sy, Elhadji Chamsidine Marena Mane, Abdoul Karim Sow and Douna Joel Koumale. Ahmadou Dicko, HDX Dakar Lab Manager also joined the call.
Tell us about the main work you are doing in the region.
Our first line of work is consolidating data from the countries in the region where OCHA works. We provide an overview of the response plans and develop humanitarian products. The Lake Chad Basin and the Sahel are the main crises we are focused on.
We also provide support to our colleagues in the field. This could be remote support or through a field mission. Team members have been deployed to the Central African Republic, Togo, Ghana and more recently to Mali and Mauritania. Soon we will deploy to the Democratic Republic of the Congo to support the response to the Ebola outbreak.
Tell us about the type of data that you are working with and getting from partners.
Lately we are getting requests for financial data—what are the funding requirements and what are the gaps? We also get requests for data about the number of people in need and targeted for assistance in the countries we cover. Money has become scarce so you really have to make the case with good data. We need to show what we will do with the money in case we get it and who is going to benefit from it.
The second type of data that we get is sectoral data. For example, partners share data on nutrition, education, and protection. The Sahel is a food security crisis so we work closely with the Food Security Cluster. We also get data on displacement and refugees.
Do you do any primary data collection or collect data directly from affected people?
We do use and aggregate this type of data provided by partners, for example in sectoral needs overviews. But at the regional office, we rarely collect data directly from affected people, like operational partners and first line responders will often do.
We are of course always very careful to minimize the risk of exposing data that would allow to identify people with names. Also in the humanitarian world, there needs to be more awareness of data security.
What are the main challenges with consolidating data?
It would help us to receive data in the same format but that is not the case. There are different formats, different reporting mechanisms. The data does not always have the same accuracy or the same timeframe, which makes creating regional products challenging.
Sometimes data is not available at a regional level or the regional data is different than what is being used at a country level. The decision around which figure to use is also challenging. For example, with financial data, FTS has data on how the sectors are being funded but the data being collected in Geneva sometimes does not reflect the current situation and the sectors have more updated data than we have. We provide this information to decision makers – to Resident Coordinators or Heads of Office – and when they go to meetings they may find that the information is outdated and we have to explain why this happens.
Another challenge is the level of disaggregation of the data from countries. Sometimes we get data from a cluster that is at the Admin 1 level (state or province) whereas we need data at Admin 2 level (district or county).
We are building a database where we can store up-to-date data. This includes the latest information for the response plans and historic data. People want trends on what has happened since 2014, 2015 and an analysis of specific locations. To do this, we have to have structured data. This is what we are working on, in close collaboration with the Dakar HDX Team.
What are the big trends that you are seeing in the region?
We concentrate on regional and sub-regional emergencies. We are focused a lot on the Lake Chad Basin, the Sahel crisis and on countries where we don’t have an OCHA office, such as Burkina Faso and Mauritania. The main problem in the Sahel is related to drought and conflict, and both have implications on food security and nutrition. And there are the long-running crises in the Central African Republic and the Democratic Republic of Congo.
Do you think it is possible to start predicting needs based on data that you are getting from different countries and sources or as it relates to drought and food security?
Yes, it is possible. For instance, last October, Action Contre La Faim provided us with an analysis of biomass levels in the region. We knew that there would be a big problem if biomass production remained low because there wouldn’t be enough food for cattle. There is also the data from WFP VAM on the market prices. The challenge is mobilizing the funds. The data has to be linked to financial systems.
Our primary focus is on getting the data into a better structure. We are trying to standardize our processes. Having the same standard for storing, visualizing and reporting would be great. We allow people to have bright ideas but no one is taking the decision to say from those ideas we will take these two forward. Having HDX here or in different regional offices can help a lot. HDX has the capacity to develop the technology that supports the standardization of collecting and storing data.
Tell us about your use of interactive visuals and dashboards.
We get a lot of requests for updated data such as the number of people displaced. People don’t want this information in a document on a shelf. They want it as quickly as possible. Business intelligence tools like Tableau and Power BI provide this capability.
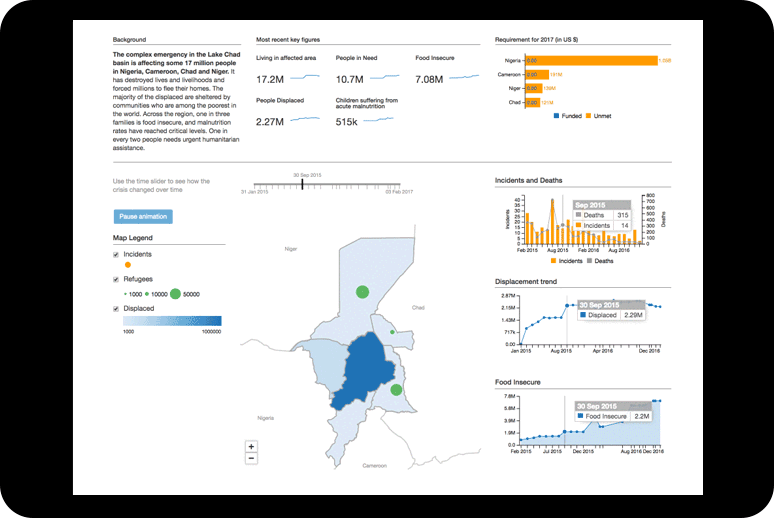
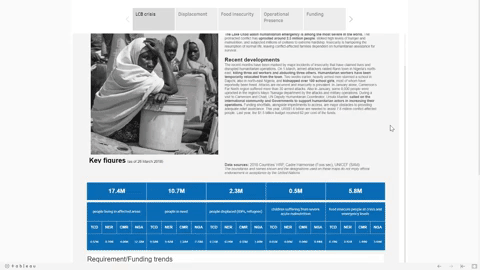
We have created an interactive visualisation for the Lake Chad Basin that includes the key figures for the crisis and the funding trends since 2016. There are separate pages to explore data on displacement, food security, funding and the operational presence of clusters.
How do you know who is using these visuals? Do you see a link between the data, the visuals and the decisions being made?
This is the main question. We are trying to measure who is using them and how we can make them more accessible by pro-active and targeted distribution rather than having people go to a website. We are reviewing our catalogue of products to assess which ones are being used and which ones can be discontinued. If a decision maker is still using paper and pen, then we can try to help him or her with accessible digital formats and print-out options.
What do you love about your job?
People working here always come in earlier than expected and leave later than expected. They like working for people they don’t know to make their lives better. Providing data to decision makers and saying who is in need and where they are is useful, and this feels good. We also like thinking about how to make things better.
This interview has been edited and condensed for clarity.