Share
There is increasing interest in machine learning and the application of statistical modeling in the humanitarian sector. When Mark Lowcock, the Head of OCHA, opened the Centre for Humanitarian Data in December 2017, he asked whether predictive analytics could be used to work out the next problem before it crystalizes so that humanitarians could act faster, cheaper and better to address it.
As the Predictive Analytics Fellow stationed in The Hague in June and July of 2018, I was asked to demonstrate the value addition of predictive analytics to the humanitarian space. Specifically, I investigated whether it is possible to anticipate the financial requirements to combat pre-famine conditions in Somalia.
This project required me to dive deep into OCHA’s humanitarian financing data and procedures for its two managed funds, the Central Emergency Response Fund (CERF) and the Country-based Pooled Funds (CBPF).
The big questions in my mind were:
- Could data and machine learning techniques complement humanitarian decision making?
- Does the necessary data exist?
- Are there practical uses to what seems like a theoretical exercise?
- Are robotic overlords coming in the near future?
Developing the Model
I spent most of my time cleaning and aggregating over a dozen datasets for a pilot study focused on Somalia. The overarching idea was to model sub-national spending information (dependent variable) against food insecurity (independent variable). Control variables such as population densities, infrastructure availability, violent events, global food and water prices, and health metrics were included in the model because they are bound to have an effect on spending.
Once the data was cleaned and merged, I trained two models (Random Forest and Elastic Net) to study spending in every district of Somalia during each of the harvest seasons (Deyr – winter rainfall season; Gu – summer rainfall season) from 2011-2017 to make predictions for 2017-2018. This step was designed to validate model performance against actual spending information, which is available for 2017 and part of 2018.
A critic could point out that such a methodology is flawed because the model is learning from past bad spending behavior and propagating the same mistakes into the future. While acknowledging this, I would say that this is only the first step in demonstrating the potential that noisy and unstructured data has if processed with caution.
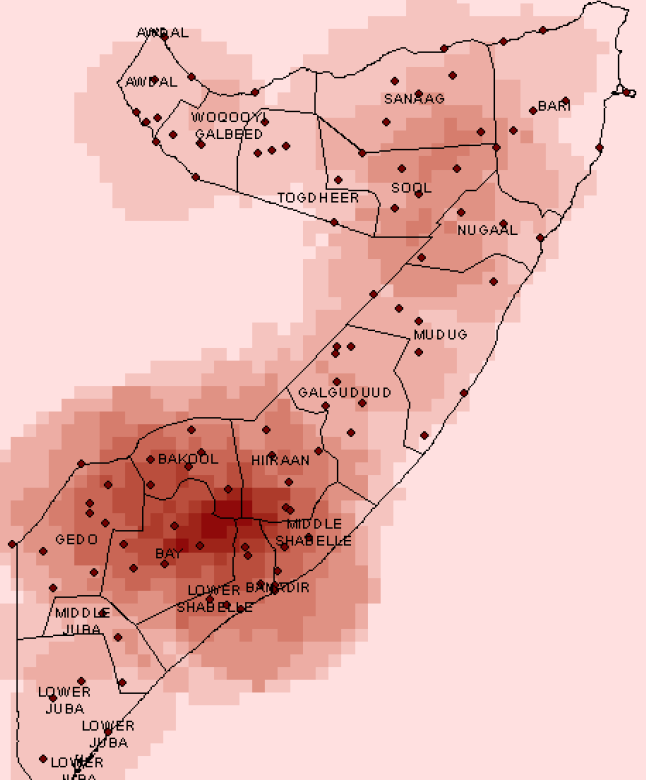
Figure 1 – Distribution of CERF funds in Somalia in 2017. A darker color represents higher spending. If this map was juxtaposed with the map showing food insecurity, we may observe that certain areas which demonstrate high need of humanitarian assistance don’t receive it. This could be for several reasons such as lack of roads and infrastructure, ongoing violence. The spending is denser in Mogadishu as the map suggests. This is where control variables play a crucial role.
Preliminary Results
The pilot study showed promising results. The model captured a good amount of variance and had low root mean squared error values. We could single out features that matter most such as beneficiary numbers, food prices, and violence (which are obvious in retrospect). The model as it currently stands only makes insightful prediction six months into the future and gets noisy as we move further away (which wasn’t as obvious).
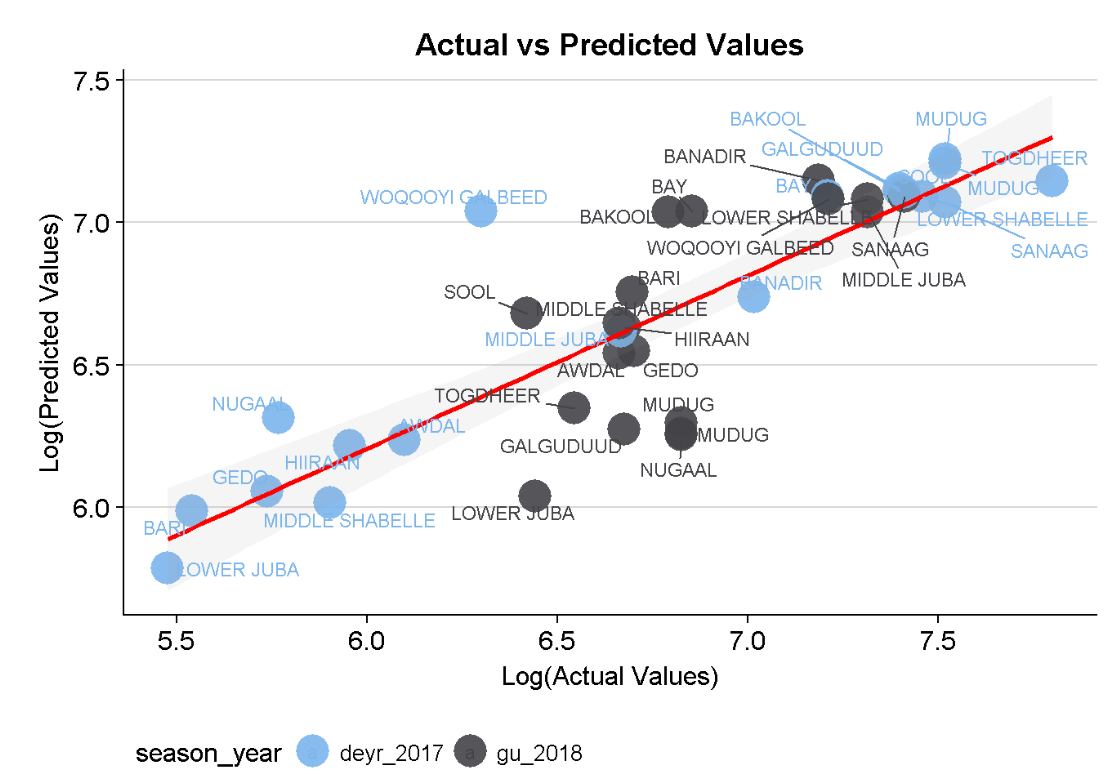
In Figure 2, I show the results of the Random Forest model making predictions for the winter rainfall season in 2017 in blue and the spring rainfall season in 2018 in black. The less accurate predictions for 2018 are clustered around the center instead of being along the red line which is ideal. For more details on the model, read this briefing note.
What’s Next?
The immediate priority is using more granular data to make precise, local predictions for Somalia. We also want to extend the model to other countries. The locations will be the same as those being assessed by the World Bank’s Famine Action Mechanism (FAM) which includes an ambitious model to anticipate famine. An optimistic future scenario is one where the World Bank model predicts an oncoming famine and our model takes that into account to project the funding required to de-escalate the situation.
I am also working with the Centre on recommendations for improving the quality of the data used in the model. Of the 800 lines of code I might have written, over 650 were just cleaning and reshaping data. Lack of built-in data integrity checks and non-uniform formats add considerable person hours to the task of data modeling. Sample errors include multiple records of the same project with different locations, the entire population of a district being counted as beneficiaries for a certain project, or locations and dates incorrectly recorded.
My long-term recommendation is to invest in understanding the impact of spending in humanitarian crises. This could lead to more data-driven decisions which are unbiased by emotion, and it could create insight about the gaps between actual needs and allotted funding.
My time at the Centre was power-packed and extremely rewarding. The humanitarian community is primed to receive and act on the fruits of quantitative and statistical analysis. Data quality is a significant hurdle but there are ways to glean information from all the noise. Even if we are not at a point where data insights can prevent a crisis altogether, a key step in this direction is anticipating crises and planning for it, and this we can do now.
Read the rest of the blogs by the 2018 Data Fellows, including their work on data storytelling, data science and user experience research. Learn more about the programme from Senior Data Fellow Stuart Campo in Part 1 and Part 2 of his summary posts. Plus, watch the Data Fellows summary video here.
I get this is a great initiative, but I think this article falls into the trap that gets many academics. The article is so full of jargon and technical words, I’m not sure how useful it is for operational work. Who in the humanitarian community would understand this phrase, “The model captured a good amount of variance and had low root mean squared error values.”? It would also have been much more meaningful to see the map actually juxtaposed on food insecurity in the region.